
Sage Therapeutics, Inc. (SAGE): Price and Financial Metrics
SAGE Price/Volume Stats
| Current price | $10.99 | 52-week high | $37.17 |
| Prev. close | $10.47 | 52-week low | $9.73 |
| Day low | $10.49 | Volume | 930,700 |
| Day high | $11.00 | Avg. volume | 1,113,027 |
| 50-day MA | $11.33 | Dividend yield | N/A |
| 200-day MA | $17.81 | Market Cap | 661.40M |
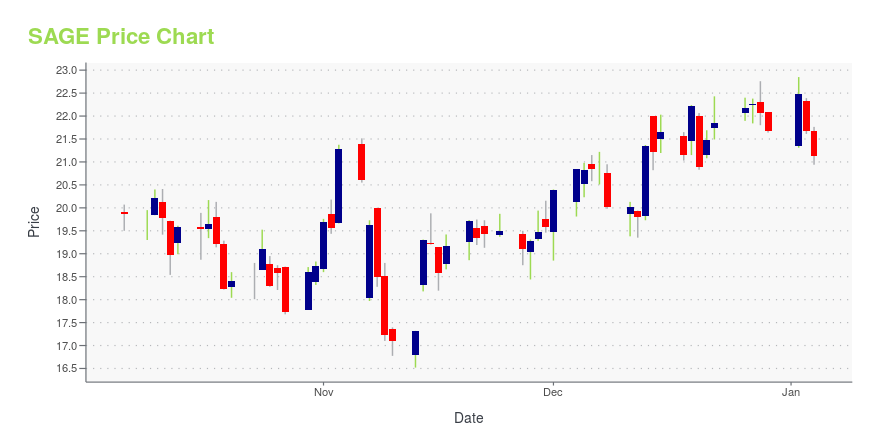
SAGE Stock Price Chart Interactive Chart >
Sage Therapeutics, Inc. (SAGE) Company Bio
Sage Therapeutics is a clinical-stage biopharmaceutical company committed to developing and commercializing novel medicines to treat life-threatening, rare central nervous system, or CNS, disorders. The company was founded in 2010 and is based in Cambridge, Massachusetts.
Latest SAGE News From Around the Web
Below are the latest news stories about SAGE THERAPEUTICS INC that investors may wish to consider to help them evaluate SAGE as an investment opportunity.
11 Most Promising Psychedelic Stocks According to Hedge FundsIn this piece, we will take a look at the 11 most promising psychedelic stocks according to hedge funds. If you want to skip our overview of the psychedelic industry and the latest news, then you can take a look at the 5 Most Promising Psychedelic Stocks. The ability to use chemicals to alter one’s […] |
ZURZUVAE™ (zuranolone) CIV, a Landmark Oral Treatment for Women with Postpartum Depression (PPD), is Now Available in the U.S.ZURZUVAE, the first and only oral, once-daily, 14-day treatment course, has shown to provide rapid improvements in depressive symptoms at Day 15 and as early as Day 3 for women with PPD Patient support program, ZURZUVAE For You, and financial assistance available to eligible women with PPD prescribed ZURZUVAE Patients will receive prescriptions directly at home via specialty pharmacy distribution model CAMBRIDGE, Mass., Dec. 14, 2023 (GLOBE NEWSWIRE) -- Biogen Inc. (Nasdaq: BIIB) and Sage Therap |
Why Is Sage Therapeutics, Inc. (SAGE) Up 12.7% Since Last Earnings Report?Sage Therapeutics, Inc. (SAGE) reported earnings 30 days ago. What's next for the stock? We take a look at earnings estimates for some clues. |
Strong week for Sage Therapeutics (NASDAQ:SAGE) shareholders doesn't alleviate pain of five-year lossLong term investing is the way to go, but that doesn't mean you should hold every stock forever. It hits us in the gut... |
Sage Therapeutics, Inc. (NASDAQ:SAGE) Q3 2023 Earnings Call TranscriptSage Therapeutics, Inc. (NASDAQ:SAGE) Q3 2023 Earnings Call Transcript November 7, 2023 Operator: Good morning. Welcome to Sage Therapeutics’ Third Quarter 2023 Conference Call. [Operator Instructions]. This call is being webcast live on the Investors and Media section of Sages’ website at sagerx.com. This call is the property of Sage Therapeutics and recording, reproduction or […] |
SAGE Price Returns
| 1-mo | 1.38% |
| 3-mo | -19.72% |
| 6-mo | -58.31% |
| 1-year | -69.30% |
| 3-year | -74.64% |
| 5-year | -93.40% |
| YTD | -49.28% |
| 2023 | -43.18% |
| 2022 | -10.34% |
| 2021 | -50.83% |
| 2020 | 19.84% |
| 2019 | -24.64% |
Continue Researching SAGE
Here are a few links from around the web to help you further your research on Sage Therapeutics Inc's stock as an investment opportunity:Sage Therapeutics Inc (SAGE) Stock Price | Nasdaq
Sage Therapeutics Inc (SAGE) Stock Quote, History and News - Yahoo Finance
Sage Therapeutics Inc (SAGE) Stock Price and Basic Information | MarketWatch
Loading social stream, please wait...