Saia, Inc. (SAIA): Price and Financial Metrics
SAIA Price/Volume Stats
Current price | $560.75 | 52-week high | $628.34 |
Prev. close | $578.08 | 52-week low | $244.69 |
Day low | $558.98 | Volume | 308,800 |
Day high | $582.22 | Avg. volume | 294,779 |
50-day MA | $520.52 | Dividend yield | N/A |
200-day MA | $423.84 | Market Cap | 14.91B |
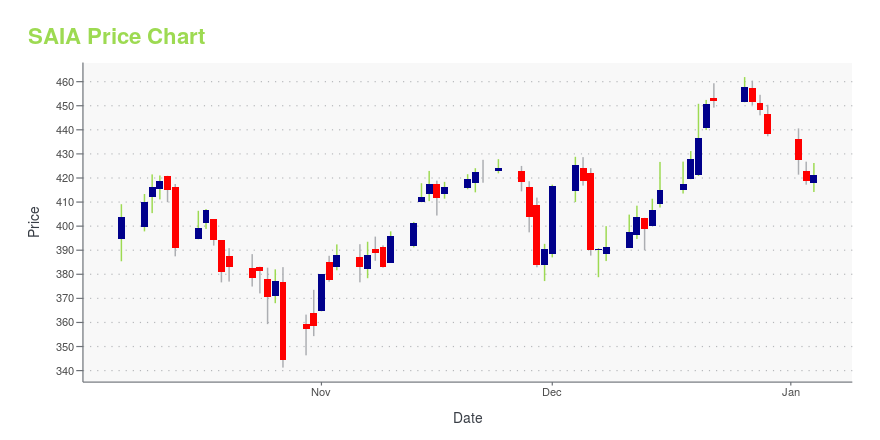
SAIA Stock Price Chart Interactive Chart >
SAIA POWR Grades
- Momentum is the dimension where SAIA ranks best; there it ranks ahead of 84.65% of US stocks.
- SAIA's strongest trending metric is Growth; it's been moving up over the last 26 weeks.
- SAIA ranks lowest in Sentiment; there it ranks in the 5th percentile.
SAIA Stock Summary
- With a market capitalization of $11,118,010,536, SAIA INC has a greater market value than 83.99% of US stocks.
- For SAIA, its debt to operating expenses ratio is greater than that reported by just 14.6% of US equities we're observing.
- SAIA's equity multiplier -- a measure of assets relative to shareholders'equity -- is greater than that of only 19.41% of US stocks.
- If you're looking for stocks that are quantitatively similar to SAIA INC, a group of peers worth examining would be TTC, VMI, MMS, LPX, and FL.
- Visit SAIA's SEC page to see the company's official filings. To visit the company's web site, go to www.saia.com.
SAIA Valuation Summary
- In comparison to the median Industrials stock, SAIA's price/sales ratio is 250% higher, now standing at 4.2.
- SAIA's price/sales ratio has moved up 3.9 over the prior 243 months.
Below are key valuation metrics over time for SAIA.
Stock | Date | P/S | P/B | P/E | EV/EBIT |
---|---|---|---|---|---|
SAIA | 2023-12-29 | 4.2 | 6.3 | 34.6 | 25.9 |
SAIA | 2023-12-28 | 4.3 | 6.4 | 35.4 | 26.5 |
SAIA | 2023-12-27 | 4.3 | 6.5 | 35.6 | 26.6 |
SAIA | 2023-12-26 | 4.4 | 6.6 | 36.1 | 27.0 |
SAIA | 2023-12-22 | 4.3 | 6.5 | 35.6 | 26.7 |
SAIA | 2023-12-21 | 4.3 | 6.5 | 35.6 | 26.6 |
SAIA Growth Metrics
- Its year over year cash and equivalents growth rate is now at 165.35%.
- Its 2 year cash and equivalents growth rate is now at 201.27%.
- Its 4 year revenue growth rate is now at 46.32%.
The table below shows SAIA's growth in key financial areas (numbers in millions of US dollars).
Date | Revenue | Operating Cash Flow | Net Income to Common Stock |
---|---|---|---|
2022-12-31 | 2,792.057 | 473.026 | 357.422 |
2022-09-30 | 2,753.412 | 458.98 | 360.321 |
2022-06-30 | 2,640.067 | 450.357 | 342.139 |
2022-03-31 | 2,465.846 | 417.582 | 295.368 |
2021-12-31 | 2,288.704 | 382.592 | 253.235 |
2021-09-30 | 2,148.105 | 337.87 | 219.71 |
SAIA's Quality Factors
The “Quality” component of the POWR Ratings focuses on 31 different factors of a companies fundamentals and operational strength. Here are some key insights as we drill into the specifics of these quality attributes.- SAIA has a Quality Grade of B, ranking ahead of 75.75% of graded US stocks.
- SAIA's asset turnover comes in at 1.303 -- ranking 22nd of 137 Transportation stocks.
- ODFL, ARCB, and PATI are the stocks whose asset turnover ratios are most correlated with SAIA.
The table below shows SAIA's key quality metrics over time.
Period | Asset Turnover | Gross Margin | ROIC |
---|---|---|---|
2021-09-30 | 1.303 | 0.705 | 0.201 |
2021-06-30 | 1.264 | 0.714 | 0.166 |
2021-03-31 | 1.188 | 0.724 | 0.132 |
2020-12-31 | 1.170 | 0.727 | 0.120 |
2020-09-30 | 1.174 | 0.724 | 0.105 |
2020-06-30 | 1.194 | 0.719 | 0.099 |
SAIA Price Target
For more insight on analysts targets of SAIA, see our SAIA price target page. And for a list of of all stocks sorted by upside potential based on analyst target price, see our Top Price Target page.
Average Price Target | $242.57 | Average Broker Recommendation | 1.67 (Moderate Buy) |
Saia, Inc. (SAIA) Company Bio
Saia, Inc. operates as a transportation company in the United States. It provides regional and interregional less-than-truckload, truckload, guaranteed, expedited, and logistics services. The company was founded in 2000 and is based in Johns Creek, Georgia.
Latest SAIA News From Around the Web
Below are the latest news stories about SAIA INC that investors may wish to consider to help them evaluate SAIA as an investment opportunity.
Logistics Leaders: 3 Stocks Streamlining Supply ChainsThese logistics companies have strong growth potential in 2024. |
Saia, Inc. Agrees to Acquire 17 Yellow Corporation Terminals in Chapter 11 Bankruptcy SaleJOHNS CREEK, Ga., Dec. 05, 2023 (GLOBE NEWSWIRE) -- Saia, Inc. (Nasdaq: SAIA), a leading transportation provider offering national less-than-truckload (LTL), non-asset truckload, expedited and logistics services, announced today that it is the winning bidder for 17 terminals of Yellow Corporation (“Yellow”) auctioned in connection with Yellow’s pending Chapter 11 bankruptcy. Saia has agreed to pay a total of $235.7 million for Yellow terminals located in the following markets: Fresno, California |
Saia holds on to Yellow’s freightSaia’s fourth-quarter update shows it is retaining the freight it onboarded as a result of Yellow’s collapse. The post Saia holds on to Yellow’s freight appeared first on FreightWaves. |
Saia Provides Fourth Quarter LTL Operating DataJOHNS CREEK, Ga., Dec. 04, 2023 (GLOBE NEWSWIRE) -- Saia, Inc. (Nasdaq: SAIA), a leading transportation provider offering national less-than-truckload (LTL), non-asset truckload, expedited and logistics services, is providing LTL shipment and tonnage data for the first two months of the fourth quarter. In October 2023, LTL shipments per workday increased 18.0%, LTL tonnage per workday increased 7.8% and LTL weight per shipment declined 8.6% to 1,321 pounds. In November 2023, LTL shipments per wo |
What Makes Saia (SAIA) a Prospective Investment?Artisan Partners, an investment management company, released its “Artisan Small Cap Fund” third quarter 2023 investor letter. A copy of the same can be downloaded here. In the third quarter, its Investor Class fund ARTSX returned -7.98%, Advisor Class fund APDSX posted a return of -7.96%, and Institutional Class fund APHSX returned -7.97%, compared to a […] |
SAIA Price Returns
1-mo | 3.70% |
3-mo | 28.45% |
6-mo | 43.75% |
1-year | 107.19% |
3-year | 156.14% |
5-year | 820.77% |
YTD | 27.96% |
2023 | 108.99% |
2022 | -37.79% |
2021 | 86.41% |
2020 | 94.16% |
2019 | 66.82% |
Continue Researching SAIA
Here are a few links from around the web to help you further your research on Saia Inc's stock as an investment opportunity:Saia Inc (SAIA) Stock Price | Nasdaq
Saia Inc (SAIA) Stock Quote, History and News - Yahoo Finance
Saia Inc (SAIA) Stock Price and Basic Information | MarketWatch
Loading social stream, please wait...