Salem Media Group, Inc. - (SALM): Price and Financial Metrics
SALM Price/Volume Stats
Current price | $0.96 | 52-week high | $2.88 |
Prev. close | $0.95 | 52-week low | $0.92 |
Day low | $0.93 | Volume | 8,480 |
Day high | $0.97 | Avg. volume | 26,742 |
50-day MA | $1.02 | Dividend yield | N/A |
200-day MA | $1.39 | Market Cap | 26.13M |
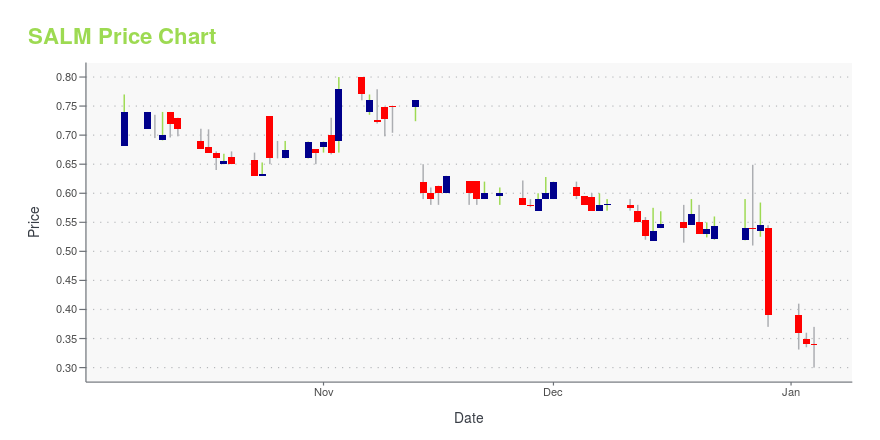
SALM Stock Price Chart Interactive Chart >
SALM Stock Summary
- SALEM MEDIA GROUP INC's market capitalization of $26,100,899 is ahead of only 9.81% of US-listed equities.
- With a price/sales ratio of 0.1, SALEM MEDIA GROUP INC has a higher such ratio than just 2.2% of stocks in our set.
- Over the past twelve months, SALM has reported earnings growth of -99.11%, putting it ahead of merely 15.03% of US stocks in our set.
- If you're looking for stocks that are quantitatively similar to SALEM MEDIA GROUP INC, a group of peers worth examining would be CORR, POR, UHT, PANL, and PNM.
- Visit SALM's SEC page to see the company's official filings. To visit the company's web site, go to www.salemmedia.com.
SALM Valuation Summary
- SALM's price/earnings ratio is -2.6; this is 119.4% lower than that of the median Consumer Cyclical stock.
- SALM's price/sales ratio has moved down 3.2 over the prior 243 months.
Below are key valuation metrics over time for SALM.
Stock | Date | P/S | P/B | P/E | EV/EBIT |
---|---|---|---|---|---|
SALM | 2023-05-19 | 0.1 | 0.2 | -2.6 | 485.1 |
SALM | 2023-05-18 | 0.1 | 0.2 | -2.5 | 483.0 |
SALM | 2023-05-17 | 0.1 | 0.2 | -2.7 | 485.5 |
SALM | 2023-05-16 | 0.1 | 0.2 | -2.7 | 485.5 |
SALM | 2023-05-15 | 0.1 | 0.2 | -2.7 | 485.5 |
SALM | 2023-05-12 | 0.1 | 0.2 | -2.7 | 485.5 |
SALM Growth Metrics
- Its year over year revenue growth rate is now at 10.18%.
- The 2 year price growth rate now stands at 212.14%.
- Its 3 year net cashflow from operations growth rate is now at -7.6%.

The table below shows SALM's growth in key financial areas (numbers in millions of US dollars).
Date | Revenue | Operating Cash Flow | Net Income to Common Stock |
---|---|---|---|
2022-09-30 | 267.282 | 17.757 | 15.811 |
2022-06-30 | 266.403 | 20.094 | 49.79 |
2022-03-31 | 261.503 | 17.607 | 42.93 |
2021-12-31 | 258.247 | 22.491 | 41.514 |
2021-09-30 | 253.595 | 14.452 | 28.002 |
2021-06-30 | 248.253 | 14.083 | 6.237 |
SALM's Quality Factors
The “Quality” component of the POWR Ratings focuses on 31 different factors of a companies fundamentals and operational strength. Here are some key insights as we drill into the specifics of these quality attributes.- SALM has a Quality Grade of D, ranking ahead of 23.32% of graded US stocks.
- SALM's asset turnover comes in at 0.466 -- ranking 20th of 64 Communication stocks.
- DISH, VG, and OSAT are the stocks whose asset turnover ratios are most correlated with SALM.
The table below shows SALM's key quality metrics over time.
Period | Asset Turnover | Gross Margin | ROIC |
---|---|---|---|
2021-06-30 | 0.466 | 0.212 | 0.054 |
2021-03-31 | 0.444 | 0.195 | 0.037 |
2020-12-31 | 0.441 | 0.176 | -0.019 |
2020-09-30 | 0.435 | 0.174 | -0.027 |
2020-06-30 | 0.432 | 0.170 | -0.072 |
2020-03-31 | 0.440 | 0.190 | -0.054 |
SALM Price Target
For more insight on analysts targets of SALM, see our SALM price target page. And for a list of of all stocks sorted by upside potential based on analyst target price, see our Top Price Target page.
Average Price Target | $4.38 | Average Broker Recommendation | 1.25 (Strong Buy) |
Salem Media Group, Inc. - (SALM) Company Bio
Salem Media Group owns and operates radio networks, which produce and distribute talk, news, and music programming to radio stations in the United States, focused on Christian and conservative-themed content. The company was founded in 1986 and is based in Camarillo, California.
Latest SALM News From Around the Web
Below are the latest news stories about SALEM MEDIA GROUP INC that investors may wish to consider to help them evaluate SALM as an investment opportunity.
Salem Media to Present at the Singular Research Spring Select WebinarIRVING, Texas, May 18, 2023--Salem Media to Present at the Singular Research Spring Select Webinar |
Salem Media Group, Inc. Announces First Quarter 2023 Total Revenue of $63.5 MillionIRVING, Texas, May 09, 2023--Salem Media Group, Inc. Announces First Quarter 2023 Total Revenue of $63.5 Million |
Salem Media Group Schedules First Quarter 2023 Earnings Release and TeleconferenceIRVING, Texas, May 04, 2023--Salem Media Group Schedules First Quarter 2023 Earnings Release and Teleconference |
Salem Music Network Team Wins Radio’s Got Talent AwardIRVING, Texas, May 02, 2023--Salem Music Network Team Wins Radio’s Got Talent Award |
Salem Media Group Announces the Appointment of Carolyn Cassidy as General Manager of Salem Surround in TampaIRVING, Texas, May 01, 2023--Salem Media Group Announces the Appointment of Carolyn Cassidy as General Manager of Salem Surround in Tampa |
SALM Price Returns
1-mo | -5.88% |
3-mo | -30.43% |
6-mo | -20.66% |
1-year | -65.71% |
3-year | -8.57% |
5-year | -71.41% |
YTD | -8.57% |
2022 | -65.69% |
2021 | 194.23% |
2020 | -25.72% |
2019 | -23.47% |
2018 | -50.16% |
Continue Researching SALM
Want to see what other sources are saying about Salem Media Group Inc's financials and stock price? Try the links below:Salem Media Group Inc (SALM) Stock Price | Nasdaq
Salem Media Group Inc (SALM) Stock Quote, History and News - Yahoo Finance
Salem Media Group Inc (SALM) Stock Price and Basic Information | MarketWatch
Loading social stream, please wait...