Sanmina Corporation (SANM): Price and Financial Metrics
SANM Price/Volume Stats
Current price | $56.13 | 52-week high | $69.28 |
Prev. close | $54.07 | 52-week low | $38.36 |
Day low | $54.45 | Volume | 362,300 |
Day high | $56.40 | Avg. volume | 450,119 |
50-day MA | $54.18 | Dividend yield | N/A |
200-day MA | $56.52 | Market Cap | 3.27B |
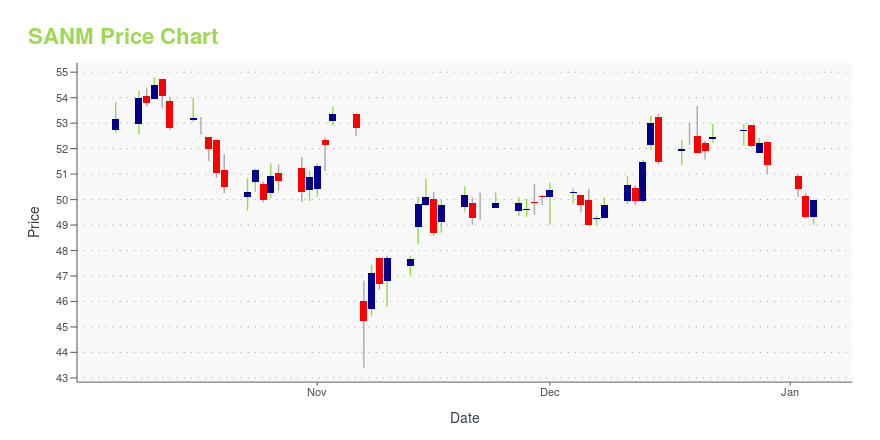
SANM Stock Price Chart Interactive Chart >
SANM POWR Grades
- Momentum is the dimension where SANM ranks best; there it ranks ahead of 98.45% of US stocks.
- The strongest trend for SANM is in Value, which has been heading up over the past 179 days.
- SANM's current lowest rank is in the Sentiment metric (where it is better than 16.77% of US stocks).
SANM Stock Summary
- The capital turnover (annual revenue relative to shareholder's equity) for SANM is 4.02 -- better than 87.37% of US stocks.
- SANM's went public 29.94 years ago, making it older than 80.37% of listed US stocks we're tracking.
- With a price/sales ratio of 0.34, SANMINA CORP has a higher such ratio than just 12.19% of stocks in our set.
- Stocks with similar financial metrics, market capitalization, and price volatility to SANMINA CORP are MRVI, CLS, CCSI, DLO, and QUOT.
- Visit SANM's SEC page to see the company's official filings. To visit the company's web site, go to www.sanmina.com.
SANM Valuation Summary
- SANM's price/sales ratio is 0.3; this is 88.46% lower than that of the median Technology stock.
- SANM's EV/EBIT ratio has moved up 7.5 over the prior 243 months.
Below are key valuation metrics over time for SANM.
Stock | Date | P/S | P/B | P/E | EV/EBIT |
---|---|---|---|---|---|
SANM | 2023-05-22 | 0.3 | 1.3 | 10.0 | 5.9 |
SANM | 2023-05-19 | 0.4 | 1.4 | 10.5 | 6.1 |
SANM | 2023-05-18 | 0.4 | 1.4 | 10.5 | 6.2 |
SANM | 2023-05-17 | 0.3 | 1.4 | 10.4 | 6.1 |
SANM | 2023-05-16 | 0.3 | 1.3 | 10.1 | 5.9 |
SANM | 2023-05-15 | 0.3 | 1.3 | 10.1 | 5.9 |
SANM Growth Metrics
- Its 2 year net cashflow from operations growth rate is now at -33.14%.
- The 5 year price growth rate now stands at -22.79%.
- The 4 year net cashflow from operations growth rate now stands at 56.53%.

The table below shows SANM's growth in key financial areas (numbers in millions of US dollars).
Date | Revenue | Operating Cash Flow | Net Income to Common Stock |
---|---|---|---|
2022-12-31 | 8,494.511 | 299.778 | 285.886 |
2022-09-30 | 7,890.475 | 330.854 | 256.121 |
2022-06-30 | 7,331.89 | 340.677 | 247.962 |
2022-03-31 | 6,970.572 | 342.715 | 285.794 |
2021-12-31 | 6,758.719 | 344.831 | 279.611 |
2021-09-30 | 6,756.643 | 338.342 | 268.998 |
SANM's Quality Factors
The “Quality” component of the POWR Ratings focuses on 31 different factors of a companies fundamentals and operational strength. Here are some key insights as we drill into the specifics of these quality attributes.- SANM has a Quality Grade of B, ranking ahead of 91.09% of graded US stocks.
- SANM's asset turnover comes in at 1.824 -- ranking 10th of 208 Electronic Equipment stocks.
- PI, RBCN, and BHE are the stocks whose asset turnover ratios are most correlated with SANM.
The table below shows SANM's key quality metrics over time.
Period | Asset Turnover | Gross Margin | ROIC |
---|---|---|---|
2021-07-03 | 1.824 | 0.082 | 0.163 |
2021-04-03 | 1.769 | 0.081 | 0.134 |
2021-01-02 | 1.678 | 0.077 | 0.115 |
2020-10-03 | 1.694 | 0.076 | 0.105 |
2020-06-27 | 1.684 | 0.074 | 0.096 |
2020-03-28 | 1.824 | 0.072 | 0.096 |
SANM Price Target
For more insight on analysts targets of SANM, see our SANM price target page. And for a list of of all stocks sorted by upside potential based on analyst target price, see our Top Price Target page.
Average Price Target | $50.67 | Average Broker Recommendation | 1.62 (Moderate Buy) |
Sanmina Corporation (SANM) Company Bio
Sanmina provides end-to-end manufacturing solutions, delivering support to OEMs primarily in the communications, defense and aerospace, industrial and semiconductor systems, medical, multimedia, computing and storage, automotive and clean technology sectors. The company was founded in 1980 and is based in San Jose, California.
Latest SANM News From Around the Web
Below are the latest news stories about SANMINA CORP that investors may wish to consider to help them evaluate SANM as an investment opportunity.
7 Deeply Undervalued Growth Stocks to Buy in JuneIf you want to enliven your portfolio with high potential bargains, these best undervalued growth stocks for June might fit the bill. |
Q2 2023 Sanmina Corp Earnings CallQ2 2023 Sanmina Corp Earnings Call |
Sanmina's Second Quarter Fiscal 2023 Financial ResultsSanmina Corporation ("Sanmina" or the "Company") (NASDAQ: SANM), a leading integrated manufacturing solutions company, today reported preliminary financial results for the fiscal second quarter ended April 1, 2023 and outlook for its fiscal third quarter ending July 1, 2023. |
Is Sanmina Ready to Emerge From a Huge Base Pattern?Sanmina Corp. is scheduled to report their latest quarterly earnings numbers after the close of trading Thursday. The company manufactures PCBAs and sub-assemblies for telecommunications systems. The On-Balance-Volume (OBV) line moved lower from early December into late April and shows a small rise in May so far. |
Is Weakness In Sanmina Corporation (NASDAQ:SANM) Stock A Sign That The Market Could be Wrong Given Its Strong Financial Prospects?It is hard to get excited after looking at Sanmina's (NASDAQ:SANM) recent performance, when its stock has declined 18... |
SANM Price Returns
1-mo | 6.21% |
3-mo | -3.62% |
6-mo | -10.16% |
1-year | 26.22% |
3-year | 95.64% |
5-year | 86.17% |
YTD | -2.02% |
2022 | 38.18% |
2021 | 30.01% |
2020 | -6.86% |
2019 | 42.31% |
2018 | -27.09% |
Continue Researching SANM
Want to do more research on Sanmina Corp's stock and its price? Try the links below:Sanmina Corp (SANM) Stock Price | Nasdaq
Sanmina Corp (SANM) Stock Quote, History and News - Yahoo Finance
Sanmina Corp (SANM) Stock Price and Basic Information | MarketWatch
Loading social stream, please wait...