
Saratoga Investment Corp New (SAR): Price and Financial Metrics
SAR Price/Volume Stats
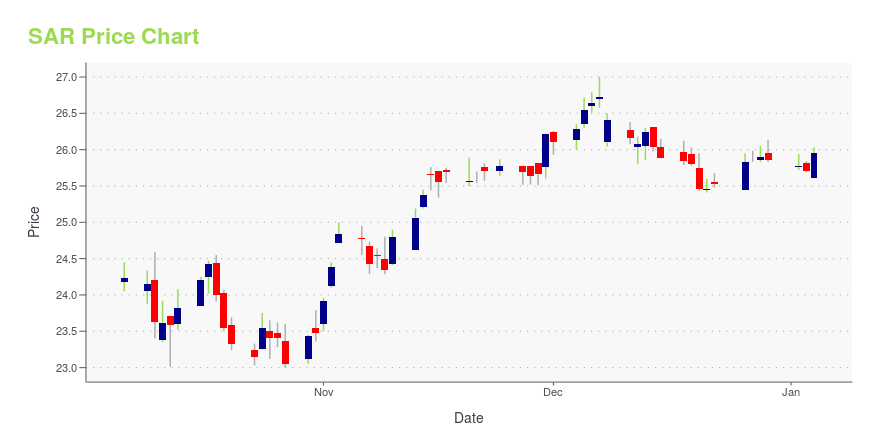
| Current price | $23.41 | 52-week high | $27.68 |
| Prev. close | $23.24 | 52-week low | $22.35 |
| Day low | $23.08 | Volume | 54,800 |
| Day high | $23.41 | Avg. volume | 82,372 |
| 50-day MA | $23.31 | Dividend yield | 12.79% |
| 200-day MA | $23.84 | Market Cap | 321.79M |
SAR Stock Price Chart Interactive Chart >
Saratoga Investment Corp New (SAR) Company Bio
Saratoga Investment Corp. is a business development company specializing in leveraged and management buyouts, acquisition financings, growth financings, recapitalization, debt refinancing, and transitional financing transactions at the lower end of middle market companies. It structures its investments as debt and equity by investing through first and second lien loans, mezzanine debt, co-investments, select high yield bonds, senior secured bonds, unsecured bonds, and preferred and common equity. The company is based in New York City, New York.
Latest SAR News From Around the Web
Below are the latest news stories about SARATOGA INVESTMENT CORP that investors may wish to consider to help them evaluate SAR as an investment opportunity.
Saratoga Investment Corp. to Report Fiscal Third Quarter 2024 Financial Results and Hold Conference CallNEW YORK, Dec. 28, 2023 (GLOBE NEWSWIRE) -- Saratoga Investment Corp. (NYSE:SAR), a business development company, will report its financial results for the fiscal quarter ended November 30, 2023, on Tuesday January 9, 2024, after market close. A conference call to discuss the financial results will be held on Wednesday January 10, 2024. Details for the conference call are provided below. Who:Christian L. Oberbeck, Chairman and Chief Executive Officer Michael J. Grisius, Chief Investment Officer |
PhenixFIN (PFX) Q4 Earnings and Revenues Top EstimatesPhenixFIN (PFX) delivered earnings and revenue surprises of 15.38% and 13.56%, respectively, for the quarter ended September 2023. Do the numbers hold clues to what lies ahead for the stock? |
Investing in Saratoga Investment (NYSE:SAR) five years ago would have delivered you a 105% gainThe main point of investing for the long term is to make money. Better yet, you'd like to see the share price move up... |
Saratoga Investment Corp. Increases Quarterly Dividend by $0.01, or 1.4%, to $0.72 per Share for the Fiscal Third Quarter Ended November 30, 2023Contact: Henri SteenkampSaratoga Investment Corp.212-906-7800 NEW YORK, Nov. 15, 2023 (GLOBE NEWSWIRE) -- Saratoga Investment Corp. (NYSE:SAR) (“Saratoga Investment” or “the Company”), a business development company, today announced that its Board of Directors has declared a quarterly dividend of $0.72 per share for the fiscal third quarter ended November 30, 2023, an increase of $0.01 from $0.71 per share in the prior fiscal second quarter, and the fifteenth quarterly dividend increase in a row |
Here's Why Saratoga Investment (SAR) Is a Great 'Buy the Bottom' Stock NowAfter losing some value lately, a hammer chart pattern has been formed for Saratoga Investment (SAR), indicating that the stock has found support. This, combined with an upward trend in earnings estimate revisions, could lead to a trend reversal for the stock in the near term. |
SAR Price Returns
| 1-mo | 2.72% |
| 3-mo | 1.26% |
| 6-mo | 5.76% |
| 1-year | -3.18% |
| 3-year | 15.60% |
| 5-year | 40.68% |
| YTD | -3.73% |
| 2023 | 12.91% |
| 2022 | -3.82% |
| 2021 | 51.00% |
| 2020 | -10.92% |
| 2019 | 34.20% |
SAR Dividends
| Ex-Dividend Date | Type | Payout Amount | Change | ||||||
|---|---|---|---|---|---|---|---|---|---|
| Loading, please wait... | |||||||||
Continue Researching SAR
Here are a few links from around the web to help you further your research on Saratoga Investment Corp's stock as an investment opportunity:Saratoga Investment Corp (SAR) Stock Price | Nasdaq
Saratoga Investment Corp (SAR) Stock Quote, History and News - Yahoo Finance
Saratoga Investment Corp (SAR) Stock Price and Basic Information | MarketWatch
Loading social stream, please wait...