
Safe Bulkers Inc. (SB): Price and Financial Metrics
SB Price/Volume Stats
| Current price | $5.45 | 52-week high | $6.33 |
| Prev. close | $5.50 | 52-week low | $2.97 |
| Day low | $5.36 | Volume | 562,788 |
| Day high | $5.51 | Avg. volume | 728,214 |
| 50-day MA | $5.73 | Dividend yield | 3.48% |
| 200-day MA | $4.59 | Market Cap | 581.86M |
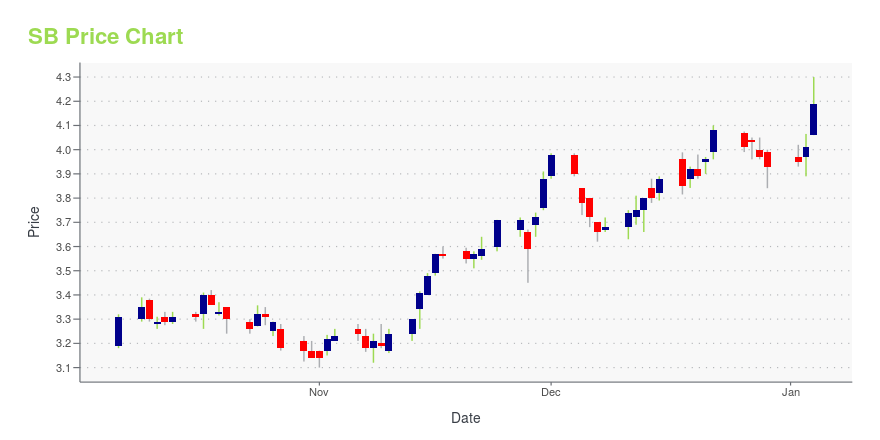
SB Stock Price Chart Interactive Chart >
Safe Bulkers Inc. (SB) Company Bio
Safe Bulkers, Inc. provides marine drybulk transportation services worldwide. It is involved in the acquisition, ownership, and operation of dry bulk vessels for transporting bulk cargoes, primarily coal, grain, and iron ore. The company was founded in 2007 and is based in Athens, Greece.
Latest SB News From Around the Web
Below are the latest news stories about SAFE BULKERS INC that investors may wish to consider to help them evaluate SB as an investment opportunity.
Safe Bulkers, Inc. Announces Agreement for the Acquisition of One Japanese Kamsarmax Class Dry-bulk VesselMONACO, Dec. 19, 2023 (GLOBE NEWSWIRE) -- Safe Bulkers, Inc. (the Company) (NYSE: SB), an international provider of marine drybulk transportation services, announced today that it has entered into an agreement for the acquisition of a Japanese, 82,000 dwt, dry-bulk, Kamsarmax class vessel with a scheduled delivery date within the first half of 2026. The newbuild vessel is designed to meet the Phase 3 requirements of Energy Efficiency Design Index related to the reduction of greenhouse gas emissi |
Best Value Stocks? 15 Stocks Dr Michael Burry Bought and SoldIn this piece, we will take a look at 15 stocks Dr Michael Burry recently bought and sold. If you want to skip our introduction to the institutional investor, then take a look at 5 Stocks Dr Michael Burry Bought and Sold. Years after accurately predicting the 2008 financial crisis and making a fortune out […] |
Safe Bulkers, Inc. Announces a Five Million Shares of Common Stock Repurchase ProgramMONACO, Nov. 30, 2023 (GLOBE NEWSWIRE) -- Safe Bulkers, Inc. (the “Company” or “Safe Bulkers”) (NYSE: SB), an international provider of marine drybulk transportation services, announced today that it has authorized a program under which it may from time to time in the future purchase up to 5,000,000 shares of the Company’s common stock. If the maximum number of shares of the Company’s common stock are purchased pursuant to the aforementioned program, it would represent approximately 4.5% of the |
14 Most Undervalued Industrial Stocks To Buy According To Hedge FundsIn this piece, we will take a look at the 14 most undervalued industrial stocks to buy according to hedge funds. If you want to skip our overview of the industrial sector and some recent developments, then take a look at 5 Most Undervalued Industrial Stocks To Buy According To Hedge Funds. If there’s one […] |
The Return Trends At Safe Bulkers (NYSE:SB) Look PromisingIf you're not sure where to start when looking for the next multi-bagger, there are a few key trends you should keep an... |
SB Price Returns
| 1-mo | -7.31% |
| 3-mo | 8.70% |
| 6-mo | 34.32% |
| 1-year | 78.38% |
| 3-year | 95.60% |
| 5-year | 184.43% |
| YTD | 41.50% |
| 2023 | 42.94% |
| 2022 | -18.69% |
| 2021 | 189.99% |
| 2020 | -23.52% |
| 2019 | -4.50% |
SB Dividends
| Ex-Dividend Date | Type | Payout Amount | Change | ||||||
|---|---|---|---|---|---|---|---|---|---|
| Loading, please wait... | |||||||||
Continue Researching SB
Want to do more research on Safe Bulkers Inc's stock and its price? Try the links below:Safe Bulkers Inc (SB) Stock Price | Nasdaq
Safe Bulkers Inc (SB) Stock Quote, History and News - Yahoo Finance
Safe Bulkers Inc (SB) Stock Price and Basic Information | MarketWatch
Loading social stream, please wait...