Splash Beverage Group Inc. (SBEV): Price and Financial Metrics
SBEV Price/Volume Stats
Current price | $0.60 | 52-week high | $1.85 |
Prev. close | $0.61 | 52-week low | $0.38 |
Day low | $0.57 | Volume | 98,500 |
Day high | $0.62 | Avg. volume | 208,858 |
50-day MA | $0.59 | Dividend yield | N/A |
200-day MA | $0.97 | Market Cap | 26.29M |
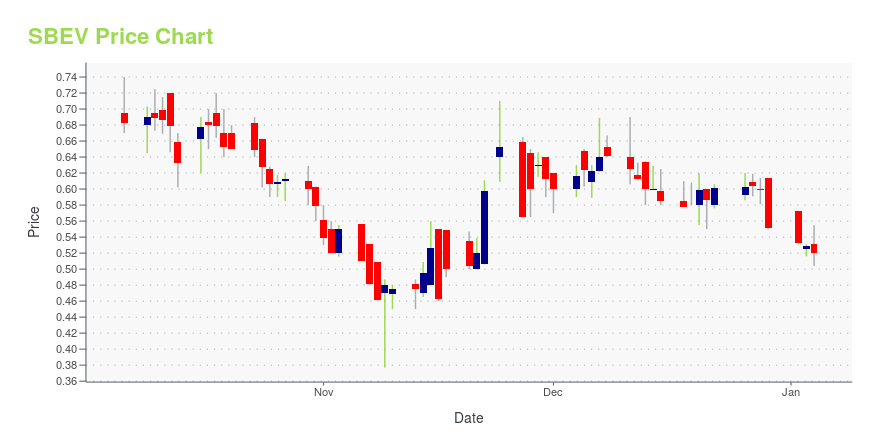
SBEV Stock Price Chart Interactive Chart >
SBEV POWR Grades
- Sentiment is the dimension where SBEV ranks best; there it ranks ahead of 83.36% of US stocks.
- The strongest trend for SBEV is in Growth, which has been heading down over the past 175 days.
- SBEV ranks lowest in Value; there it ranks in the 0th percentile.
SBEV Stock Summary
- SBEV has a higher market value than only 10.13% of US stocks; more precisely, its current market capitalization is $20,334,996.
- The capital turnover (annual revenue relative to shareholder's equity) for SBEV is 5.21 -- better than 91.38% of US stocks.
- With a year-over-year growth in debt of 107.22%, SPLASH BEVERAGE GROUP INC's debt growth rate surpasses 91.79% of about US stocks.
- If you're looking for stocks that are quantitatively similar to SPLASH BEVERAGE GROUP INC, a group of peers worth examining would be ITP, DDS, KSS, ITIC, and PFIS.
- SBEV's SEC filings can be seen here. And to visit SPLASH BEVERAGE GROUP INC's official web site, go to www.splashbeveragegroup.com.
SBEV Valuation Summary
- SBEV's price/sales ratio is 1.1; this is 22.22% higher than that of the median Consumer Defensive stock.
- SBEV's price/earnings ratio has moved up 6.6 over the prior 40 months.
Below are key valuation metrics over time for SBEV.
Stock | Date | P/S | P/B | P/E | EV/EBIT |
---|---|---|---|---|---|
SBEV | 2023-11-06 | 1.1 | 5.5 | -1.1 | -1.4 |
SBEV | 2023-11-03 | 1.1 | 5.9 | -1.2 | -1.5 |
SBEV | 2023-11-02 | 1.1 | 5.6 | -1.2 | -1.4 |
SBEV | 2023-11-01 | 1.1 | 5.8 | -1.2 | -1.5 |
SBEV | 2023-10-31 | 1.2 | 6.2 | -1.3 | -1.5 |
SBEV | 2023-10-30 | 1.2 | 6.5 | -1.3 | -1.6 |
SBEV's Quality Factors
The “Quality” component of the POWR Ratings focuses on 31 different factors of a companies fundamentals and operational strength. Here are some key insights as we drill into the specifics of these quality attributes.- SBEV has a Quality Grade of F, ranking ahead of 2.56% of graded US stocks.
- SBEV's asset turnover comes in at 0.56 -- ranking 6th of 16 Beer & Liquor stocks.
- 500 - Internal server error
The table below shows SBEV's key quality metrics over time.
Period | Asset Turnover | Gross Margin | ROIC |
---|---|---|---|
2021-06-30 | 0.560 | 0.248 | -11.353 |
2021-03-31 | 0.470 | 0.264 | -18.210 |
2021-03-31 | 0.470 | 0.264 | -18.210 |
2020-12-31 | 0.266 | 0.243 | -438.743 |
Splash Beverage Group Inc. (SBEV) Company Bio
Splash Beverage Group, Inc. produces, distributes, and markets various beverages in the United States. The company offers hydration and recovery isotonic sport drink under the TapouT Performance brand; and flavored tequilas under the SALT Naturally Flavored Tequila brand. It also sells beverages and groceries online through qplash.com; produces premium wine under the Copa di Vino brand; and offers premium Pulpoloco Sangria. The company is based in Fort Lauderdale, Florida.
Latest SBEV News From Around the Web
Below are the latest news stories about SPLASH BEVERAGE GROUP INC that investors may wish to consider to help them evaluate SBEV as an investment opportunity.
Splash Beverage Group’s Copa di Vino and Pulpoloco Sangrias to be Featured in AMPM’s Thorntons Convenience StoresFORT LAUDERDALE, FL, Nov. 21, 2023 (GLOBE NEWSWIRE) -- via NewMediaWire - Splash Beverage Group, Inc. (NYSE American: SBEV) (“Splash” or the “Company”), a portfolio company of leading beverage brands, today announced that Thornton convenience store chain will be featuring Copa di Vino single serve premium wines and Pulpoloco Sangria in Illinois and surrounding areas. The launch will feature (4) varietals of Copa di Vino Premium Wine and (2) varietals of Pulpoloco Sangria. Bill Meisner, Splash Be |
Splash Beverage Groups Copa di Vino Brand Received Walmart’s Coveted Golden Ticket Award for Its Lineup of Premium Single Serve WineSplash Beverage Group, Inc. Golden Ticket Award FORT LAUDERDALE, FL, Nov. 16, 2023 (GLOBE NEWSWIRE) -- via NewMediaWire –Splash Beverage Group, Inc. (NYSE American: SBEV) (“Splash” or the “Company”), a portfolio company of leading beverage brands, today announced that retailing giant, Wal-Mart, will be featuring the Copa di Vino brand in the Southeast U.S. The rollout will feature a minimum of 2 varietals of four packs of Copa di Vino. The Company expects shipping to begin in late Q1. At Walmart |
Splash Beverage Group Reports Third Quarter 2023 Financial Results, Quarterly Revenues Rise 5%, Nine Month Revenues Rise 22%FORT LAUDERDALE, FL, Nov. 14, 2023 (GLOBE NEWSWIRE) -- via NewMediaWire –Splash Beverage Group, Inc. (NYSE American: SBEV) ("Splash" or the "Company"), a portfolio company of leading beverage brands, today reported financial results for the third quarter period ended September 30, 2023. Investors are encouraged to read the Company’s quarterly report on Form 10-Q which was filed with the Securities and Exchange Commissions (the “SEC”), contains additional information, and is posted at https://spl |
Boston Beer (SAM) Tops Q3 Earnings and Revenue EstimatesBoston Beer (SAM) delivered earnings and revenue surprises of 9.65% and 1.47%, respectively, for the quarter ended September 2023. Do the numbers hold clues to what lies ahead for the stock? |
Splash Beverage Group’s Copa di Vino to be Featured in Circle K Divisions in Alabama and Northern FloridaFORT LAUDERDALE, FL, Oct. 12, 2023 (GLOBE NEWSWIRE) -- via NewMediaWire -- Splash Beverage Group, Inc. (NYSE American: SBEV) (“Splash” or the “Company”), a portfolio company of leading beverage brands, today announced that convenience store retailing giant, Circle K, will be featuring the Copa di Vino brand in greater than 130 locations in Alabama and Florida. The rollout will feature 4 varietals of Splash’s premium single serve wine, Copa di Vino. It is expected that the stores will begin selli |
SBEV Price Returns
1-mo | 9.11% |
3-mo | N/A |
6-mo | -43.40% |
1-year | -39.99% |
3-year | -81.13% |
5-year | N/A |
YTD | -37.59% |
2022 | -17.69% |
2021 | -66.72% |
2020 | 37.65% |
2019 | N/A |
2018 | N/A |
Loading social stream, please wait...