
SB Financial Group, Inc. (SBFG): Price and Financial Metrics
SBFG Price/Volume Stats
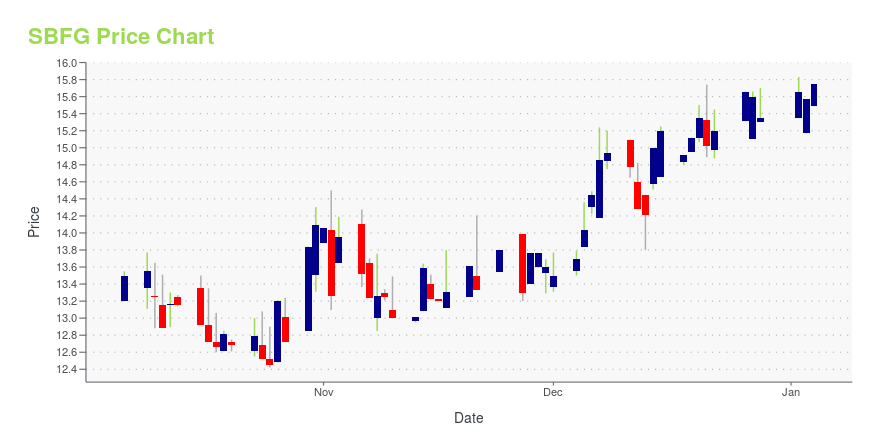
| Current price | $16.23 | 52-week high | $16.32 |
| Prev. close | $15.37 | 52-week low | $12.42 |
| Day low | $15.40 | Volume | 6,359 |
| Day high | $16.32 | Avg. volume | 3,560 |
| 50-day MA | $14.12 | Dividend yield | 3.64% |
| 200-day MA | $14.12 | Market Cap | 109.78M |
SBFG Stock Price Chart Interactive Chart >
SB Financial Group, Inc. (SBFG) Company Bio
SB Financial Group Inc is a financial services holding company. The Bank offers a full-range of financial services for consumers and small businesses, including trust services, mortgage banking, commercial and agricultural lending. SB Financial Group provides data and item processing services to community banks located primarily in the Midwest.
Latest SBFG News From Around the Web
Below are the latest news stories about SB FINANCIAL GROUP INC that investors may wish to consider to help them evaluate SBFG as an investment opportunity.
SB Financial Group, Inc. (SBFG) Soars 5.6%: Is Further Upside Left in the Stock?SB Financial Group, Inc. (SBFG) witnessed a jump in share price last session on above-average trading volume. The latest trend in earnings estimate revisions for the stock doesn't suggest further strength down the road. |
Horizon Bancorp (HBNC) Surges 15.1%: Is This an Indication of Further Gains?Horizon Bancorp (HBNC) was a big mover last session on higher-than-average trading volume. The latest trend in earnings estimate revisions might not help the stock continue moving higher in the near term. |
SB Financial Group Inc (SBFG) Reports 19.6% Decrease in Net Income for Q3 2023Despite the decline in net income, the company sees a 25.8% increase in interest income and a 6.9% growth in total loans |
SB Financial Group, Inc. (NASDAQ:SBFG) Q3 2023 Earnings Call TranscriptSB Financial Group, Inc. (NASDAQ:SBFG) Q3 2023 Earnings Call Transcript October 31, 2023 Operator: Good morning, and welcome to the SB Financial Third Quarter 2023 Conference Call and Webcast. I would like to inform you that this conference call is being recorded and that all participants is in a listen only mode. We will begin […] |
Q3 2023 SB Financial Group Inc Earnings CallQ3 2023 SB Financial Group Inc Earnings Call |
SBFG Price Returns
| 1-mo | 15.93% |
| 3-mo | 19.60% |
| 6-mo | 4.62% |
| 1-year | 20.65% |
| 3-year | -0.68% |
| 5-year | 20.93% |
| YTD | N/A |
| 2023 | 0.00% |
| 2022 | -7.04% |
| 2021 | 10.18% |
| 2020 | -4.73% |
| 2019 | 22.20% |
SBFG Dividends
| Ex-Dividend Date | Type | Payout Amount | Change | ||||||
|---|---|---|---|---|---|---|---|---|---|
| Loading, please wait... | |||||||||
Continue Researching SBFG
Here are a few links from around the web to help you further your research on Sb Financial Group Inc's stock as an investment opportunity:Sb Financial Group Inc (SBFG) Stock Price | Nasdaq
Sb Financial Group Inc (SBFG) Stock Quote, History and News - Yahoo Finance
Sb Financial Group Inc (SBFG) Stock Price and Basic Information | MarketWatch
Loading social stream, please wait...