
SilverBow Resources, Inc. (SBOW): Price and Financial Metrics
SBOW Price/Volume Stats
| Current price | $37.73 | 52-week high | $43.95 |
| Prev. close | $38.48 | 52-week low | $25.19 |
| Day low | $37.44 | Volume | 179,603 |
| Day high | $38.90 | Avg. volume | 515,536 |
| 50-day MA | $38.00 | Dividend yield | N/A |
| 200-day MA | $32.69 | Market Cap | 963.62M |
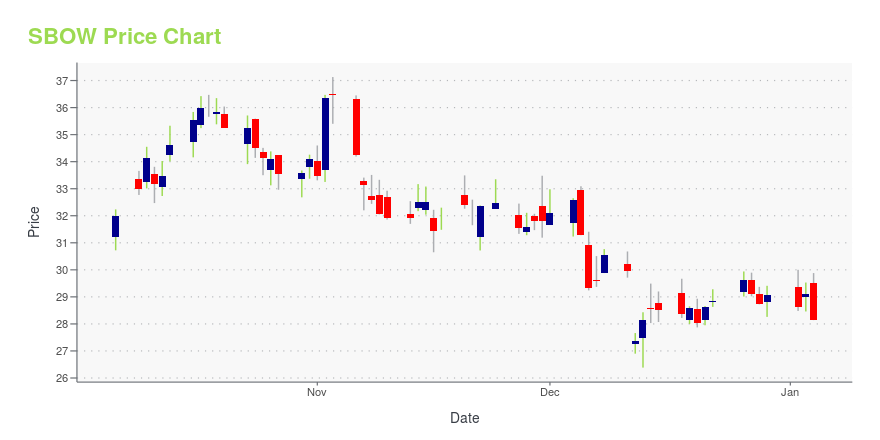
SBOW Stock Price Chart Interactive Chart >
SilverBow Resources, Inc. (SBOW) Company Bio
SilverBow Resources, Inc. operates as an independent oil and natural gas exploration and production company. It primarily focuses on assets located in the Eagle Ford Shale in South Texas. The company was formerly known as Swift Energy Company and changed its name to SilverBow Resources, Inc. in May 2017. SilverBow Resources, Inc. was founded in 1979 and is based in Houston, Texas.
Latest SBOW News From Around the Web
Below are the latest news stories about SILVERBOW RESOURCES INC that investors may wish to consider to help them evaluate SBOW as an investment opportunity.
Dow Up Triple Digits As Oil Prices PlummetThe S&P 500 Index and Nasdaq Composite are also higher, as investors await tomorrow's interest rate decision. |
SilverBow Resources Announces Upsize and Pricing of Secondary Offering of Common StockHOUSTON, December 12, 2023--SilverBow Resources, Inc. (NYSE: SBOW) ("SilverBow" or the "Company") today announced the upsize and pricing of a previously announced underwritten public offering of its common stock (the "Offering") by an affiliate of Strategic Value Partners, LLC (the "Selling Stockholder"). The size of the Offering increased from the previously announced 1,700,000 shares to an aggregate of 2,200,000 shares of common stock held by the Selling Stockholder. The Selling Stockholder ha |
SilverBow Resources Announces Secondary Offering of Common StockHOUSTON, December 11, 2023--SilverBow Resources, Inc. (NYSE: SBOW) ("SilverBow" or the "Company") today announced that an affiliate of Strategic Value Partners, LLC (the "Selling Stockholder") intends to offer for sale 1,700,000 shares of the Company’s common stock in an underwritten public offering (the "Offering"). The Selling Stockholder intends to grant the underwriters a 30-day option to purchase up to an additional 255,000 shares. |
SilverBow Resources Announces Closing of Chesapeake Acquisition and Provides Updated 2023 Guidance & Preliminary 2024 OutlookHOUSTON, November 30, 2023--SilverBow Resources, Inc. (NYSE: SBOW) ("SilverBow" or "the Company") announced today the closing of its acquisition of Chesapeake Energy Corporation’s ("Chesapeake") oil and gas assets in South Texas for a purchase price of $700 million, comprised of a $650 million upfront cash payment paid at closing and an additional $50 million deferred cash payment due 12 months post close, subject to customary adjustments (the "Chesapeake Transaction"). Consideration for the pur |
UPDATE 1-Top shareholders push for board overhaul at energy producer SilverBowTwo of SilverBow Resources Inc's largest investors are pushing the U.S. oil and gas producer to revamp its board to address governance concerns and boost its lagging performance, according to statements on Thursday. Hedge fund Riposte Capital, which currently holds a 6.7% stake in SilverBow, in a letter to the company urged SilverBow to appoint three new directors to its board, months after Reuters reported the investor's attempts to push the shale producer to drop anti-takeover defences and explore a sale. In its latest letter, the fourth-largest stockholder called on the company to appoint new board members at the shareholder meeting due next year, having failed to act on its earlier demands and, instead, pursued a strategy that resulted in a further underperformance against rivals. |
SBOW Price Returns
| 1-mo | 1.81% |
| 3-mo | 17.80% |
| 6-mo | 37.90% |
| 1-year | 12.19% |
| 3-year | 89.79% |
| 5-year | 263.49% |
| YTD | 29.75% |
| 2023 | 2.83% |
| 2022 | 29.90% |
| 2021 | 309.98% |
| 2020 | -46.36% |
| 2019 | -58.12% |
Continue Researching SBOW
Want to see what other sources are saying about Silverbow Resources Inc's financials and stock price? Try the links below:Silverbow Resources Inc (SBOW) Stock Price | Nasdaq
Silverbow Resources Inc (SBOW) Stock Quote, History and News - Yahoo Finance
Silverbow Resources Inc (SBOW) Stock Price and Basic Information | MarketWatch
Loading social stream, please wait...