ScanSource, Inc. (SCSC): Price and Financial Metrics
GET POWR RATINGS... FREE!
SCSC POWR Grades
- Sentiment is the dimension where SCSC ranks best; there it ranks ahead of 92.63% of US stocks.
- SCSC's strongest trending metric is Stability; it's been moving up over the last 179 days.
- SCSC's current lowest rank is in the Growth metric (where it is better than 46.55% of US stocks).
SCSC Stock Summary
- Scansource Inc's capital turnover -- a measure of revenue relative to shareholder's equity -- is better than 90.27% of US listed stocks.
- With a price/sales ratio of 0.27, Scansource Inc has a higher such ratio than merely 4.55% of stocks in our set.
- In terms of twelve month growth in earnings before interest and taxes, Scansource Inc is reporting a growth rate of -148.21%; that's higher than merely 12.83% of US stocks.
- Stocks that are quantitatively similar to SCSC, based on their financial statements, market capitalization, and price volatility, are FORR, CRAI, MEDS, ESE, and GBL.
- SCSC's SEC filings can be seen here. And to visit Scansource Inc's official web site, go to www.scansource.com.
SCSC Valuation Summary
- In comparison to the median Technology stock, SCSC's price/sales ratio is 94.5% lower, now standing at 0.3.
- Over the past 243 months, SCSC's price/earnings ratio has gone up 64.6.
- Over the past 243 months, SCSC's price/sales ratio has gone down 0.2.
Below are key valuation metrics over time for SCSC.
Stock | Date | P/S | P/B | P/E | EV/EBIT |
---|---|---|---|---|---|
SCSC | 2021-09-01 | 0.3 | 1.2 | 81.7 | 32.2 |
SCSC | 2021-08-31 | 0.3 | 1.2 | 84.0 | 33.1 |
SCSC | 2021-08-30 | 0.3 | 1.3 | 85.4 | 33.6 |
SCSC | 2021-08-27 | 0.3 | 1.3 | 85.2 | 33.5 |
SCSC | 2021-08-26 | 0.3 | 1.2 | 83.3 | 32.8 |
SCSC | 2021-08-25 | 0.3 | 1.2 | 83.6 | 32.9 |
SCSC Growth Metrics
- Its 3 year price growth rate is now at -8.78%.
- The 3 year net income to common stockholders growth rate now stands at -15.99%.
- Its 5 year net income to common stockholders growth rate is now at -46.1%.

The table below shows SCSC's growth in key financial areas (numbers in millions of US dollars).
Date | Revenue | Operating Cash Flow | Net Income to Common Stock |
---|---|---|---|
2021-12-31 | 3,304.23 | -71.816 | 82.133 |
2021-09-30 | 3,250.776 | -19.097 | 44.687 |
2021-06-30 | 3,150.806 | 140.94 | 10.795 |
2021-03-31 | 2,495.034 | 153.314 | -230.177 |
2020-12-31 | 2,637.644 | 245.589 | -241.562 |
2020-09-30 | 2,816.25 | 282.349 | -216.002 |
SCSC's Quality Factors
The “Quality” component of the POWR Ratings focuses on 31 different factors of a companies fundamentals and operational strength. Here are some key insights as we drill into the specifics of these quality attributes.- SCSC has a Quality Grade of B, ranking ahead of 75.25% of graded US stocks.
- SCSC's asset turnover comes in at 1.914 -- ranking 40th of 105 Wholesale stocks.
- DLA, CHEF, and PFGC are the stocks whose asset turnover ratios are most correlated with SCSC.
The table below shows SCSC's key quality metrics over time.
Period | Asset Turnover | Gross Margin | ROIC |
---|---|---|---|
2021-06-30 | 1.914 | 0.111 | 0.043 |
2021-03-31 | 1.511 | 0.116 | -0.296 |
2020-12-31 | 1.487 | 0.112 | -0.281 |
2020-09-30 | 1.461 | 0.115 | -0.212 |
2020-06-30 | 1.488 | 0.117 | -0.157 |
2020-03-31 | 1.788 | 0.112 | 0.055 |
SCSC Price Target
For more insight on analysts targets of SCSC, see our SCSC price target page. And for a list of of all stocks sorted by upside potential based on analyst target price, see our Top Price Target page.
Average Price Target | $39.33 | Average Broker Recommendation | 1.17 (Strong Buy) |
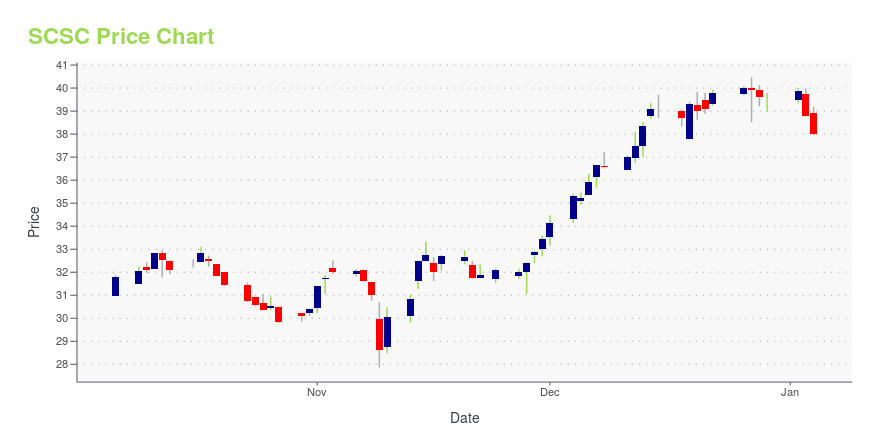
SCSC Stock Price Chart Interactive Chart >
SCSC Price/Volume Stats
Current price | $31.16 | 52-week high | $41.01 |
Prev. close | $31.14 | 52-week low | $24.89 |
Day low | $30.45 | Volume | 92,700 |
Day high | $31.55 | Avg. volume | 121,498 |
50-day MA | $35.37 | Dividend yield | N/A |
200-day MA | $34.49 | Market Cap | 786.23M |
ScanSource, Inc. (SCSC) Company Bio
ScanSource, Inc. operates as a wholesale distributor of specialty technology products in North America and internationally. It operates in two segments, Worldwide Barcode & Security and Worldwide Communications & Services. The company was founded in 1992 and is based in Greenville, South Carolina.
Latest SCSC News From Around the Web
Below are the latest news stories about Scansource Inc that investors may wish to consider to help them evaluate SCSC as an investment opportunity.
Zacks Industry Outlook Highlights: Ashtead Group PLC, W.W. Grainger, Inc., SiteOne Landscape Supply, Inc. and ScanSource, IncAshtead Group PLC, W.W. Grainger, Inc., SiteOne Landscape Supply, Inc. and ScanSource, Inc are highlighted in this Industry Outlook article. |
4 Industrial Services Stocks to Watch Amid Supply Chain WoesDespite the ongoing momentum in manufacturing activity, supply chain headwinds and higher costs mar the near-term outlook for the Zacks Industrial Services industry. The likes of ASHTY, GWW, SITE and SCSC will gain from their ongoing focus on enhancing digital capabilities. |
ScanSource, Inc. (SCSC) CEO Michael Baur on Q2 2022 Results - Earnings Call TranscriptScanSource, Inc. (SCSC) Q2 2022 Earnings Conference Call Feb 08, 2022, 05:00 PM ET Company Participants Mary Gentry - VP, Treasurer and IR Michael Baur - Chairman and CEO John Eldh - Senior EVP and Chief Revenue Officer Stephen Jones - Senior Executive Vice President and CFO Conference Call Participants... |
ScanSource (SCSC) Q2 Earnings & Sales Beat Estimates, Up Y/YScanSource's (SCSC) second-quarter fiscal 2022 top-line results benefit from strong demand. Backed by this trend, the company anticipates sales growth of at least 7% in fiscal 2022. |
ScanSource, Inc. Names John Eldh as PresidentGREENVILLE, S.C., February 09, 2022--ScanSource, Inc. (NASDAQ: SCSC), a leading hybrid distributor connecting devices to the cloud, announced today that John Eldh has been named President of ScanSource, Inc. As President, Eldh reports to Chairman and CEO Mike Baur, who served as President of ScanSource, Inc. from 1992 until Eldh’s appointment. |
SCSC Price Returns
1-mo | -19.42% |
3-mo | -4.88% |
6-mo | -11.45% |
1-year | N/A |
3-year | -4.91% |
5-year | -19.94% |
YTD | -11.17% |
2021 | 32.98% |
2020 | -28.61% |
2019 | 7.48% |
2018 | -3.97% |
2017 | -11.28% |
Continue Researching SCSC
Want to see what other sources are saying about Scansource Inc's financials and stock price? Try the links below:Scansource Inc (SCSC) Stock Price | Nasdaq
Scansource Inc (SCSC) Stock Quote, History and News - Yahoo Finance
Scansource Inc (SCSC) Stock Price and Basic Information | MarketWatch
Loading social stream, please wait...