
Sculptor Capital Management, Inc. (SCU): Price and Financial Metrics
SCU Price/Volume Stats
| Current price | $12.72 | 52-week high | $12.78 |
| Prev. close | $12.75 | 52-week low | $7.93 |
| Day low | $12.72 | Volume | 2,910,300 |
| Day high | $12.77 | Avg. volume | 245,566 |
| 50-day MA | $12.20 | Dividend yield | 2.12% |
| 200-day MA | $10.08 | Market Cap | 797.10M |
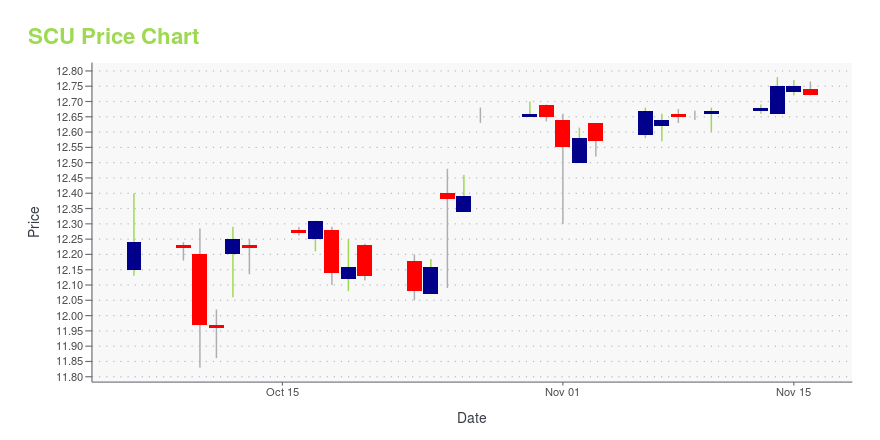
SCU Stock Price Chart Interactive Chart >
Sculptor Capital Management, Inc. (SCU) Company Bio
Sculptor Capital Management, Inc. operates as a global alternative asset management firm. The Company providing investment products in a range of areas including multi-strategy, credit, and real estate. Sculptor Capital Management serves clients worldwide.
Latest SCU News From Around the Web
Below are the latest news stories about SCULPTOR CAPITAL MANAGEMENT INC that investors may wish to consider to help them evaluate SCU as an investment opportunity.
Rithm Capital completes acquisition of SculptorNew York-based Rithm Capital announced on Friday it completed the acquisition of Sculptor Capital Management for $719.8 million. |
Rithm Completes Deal to Buy Hedge Fund Sculptor After Monthslong Drama(Bloomberg) -- Rithm Capital Corp. finally completed a deal to buy struggling asset manager Sculptor Capital Management Inc., dashing the ambitions of a hedge fund founder and handing a 35% gain to shareholders.Most Read from BloombergAston Martin Owner Lawrence Stroll Sells F1 Team Stake at £1 Billion ValuationBacklash Spreads Over Musk’s Endorsement of Antisemitic PostAltman Ousted From OpenAI, Board Says It Lost ConfidenceHamas Mastermind Who Tricked Israel Is Top Target in Gaza TunnelsApple |
A Wall Street disaster’s final chapterAlso in today’s newsletter, Mars pays extragalactic premium for Hotel Chocolat and Blackstone seeks new financing options |
Brigade, Sculptor Among Now-Bankrupt WeWork’s Biggest Creditors(Bloomberg) -- Brigade Capital Management, Capital Research and Management Co. and Sculptor Capital are among now-bankrupt WeWork Inc.’s biggest creditors, court papers show. Most Read from BloombergAston Martin Owner Lawrence Stroll Sells F1 Team Stake at £1 Billion ValuationHamas Mastermind Who Tricked Israel Is Top Target in Gaza TunnelsApple Plans to Make It Easier to Text Between iPhones and Androids‘Fed-Friendly’ Data Lift Bonds as S&P 500 Wavers: Markets WrapApple’s Effort to Replace Qual |
Sale of Sculptor Capital on cusp of approval after hedge fund brawlShareholders of Sculptor Capital Management are poised to approve a $720mn buyout by Rithm Capital, ending an unusually contentious fight for the once high-flying hedge fund valued at $12bn when it went public in 2007. The shareholder vote scheduled on Thursday comes a year after Sculptor, formerly known as Och-Ziff Capital Management, launched a sale process intended to ease tensions between its billionaire founder Daniel Och and chief executive Jimmy Levin, a one-time Och protégé. Sculptor’s board in July agreed to sell the hedge fund to Rithm at $11.15 a share. |
SCU Price Returns
| 1-mo | N/A |
| 3-mo | N/A |
| 6-mo | N/A |
| 1-year | 16.59% |
| 3-year | -39.96% |
| 5-year | -33.57% |
| YTD | N/A |
| 2023 | 0.00% |
| 2022 | -58.43% |
| 2021 | 62.07% |
| 2020 | -29.87% |
| 2019 | 152.49% |
SCU Dividends
| Ex-Dividend Date | Type | Payout Amount | Change | ||||||
|---|---|---|---|---|---|---|---|---|---|
| Loading, please wait... | |||||||||
Loading social stream, please wait...