
SCYNEXIS, Inc. (SCYX): Price and Financial Metrics
SCYX Price/Volume Stats
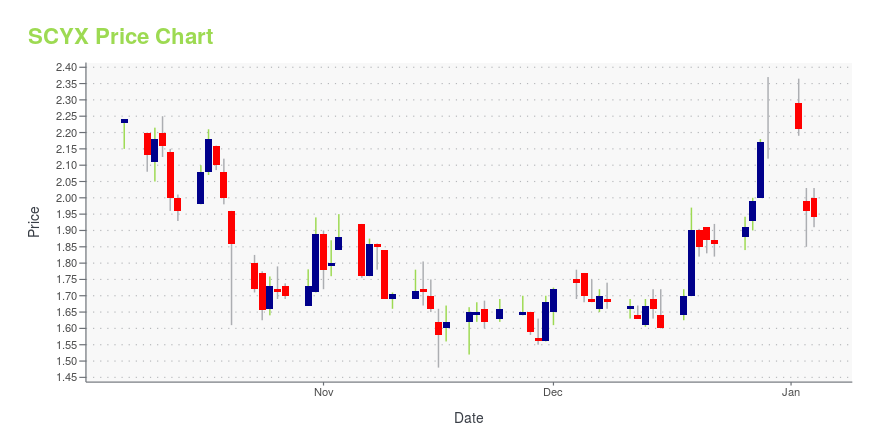
| Current price | $2.11 | 52-week high | $3.87 |
| Prev. close | $2.09 | 52-week low | $1.35 |
| Day low | $2.09 | Volume | 36,000 |
| Day high | $2.14 | Avg. volume | 209,083 |
| 50-day MA | $2.17 | Dividend yield | N/A |
| 200-day MA | $1.86 | Market Cap | 79.72M |
SCYX Stock Price Chart Interactive Chart >
SCYNEXIS, Inc. (SCYX) Company Bio
SCYNEXIS, Inc., a pharmaceutical company, develops and commercializes novel anti-infectives to address unmet therapeutic needs. Its lead product candidate includes SCY-078, which is in Phase I clinical trials of the intravenous formulation; Phase II clinical trials for the treatment of invasive candida infections; and Phase II clinical trials for unmet medical needs, such as vulvovaginal candidiasis. The company was founded in 1999 and is based in Jersey City, New Jersey.
Latest SCYX News From Around the Web
Below are the latest news stories about SCYNEXIS INC that investors may wish to consider to help them evaluate SCYX as an investment opportunity.
Shareholders in SCYNEXIS (NASDAQ:SCYX) are in the red if they invested five years agoWe're definitely into long term investing, but some companies are simply bad investments over any time frame. It hits... |
11 Cheapest Stocks With Biggest UpsideIn this piece, we will take a look at the 11 cheapest stocks with the biggest upside. If you want to skip our introduction to stock valuation and recent market news, then take a look at 5 Cheapest Stocks With Biggest Upside. Identifying the right stocks to invest in is a science that involves evaluating […] |
SCYNEXIS Reports Third Quarter 2023 Financial Results and Provides Corporate UpdateIND enabling development activities for SCY-247, the next generation fungerp from SCYNEXIS’ proprietary antifungal platform, continue to advanceRemediation strategies following the voluntary recall of BREXAFEMME® and the MARIO study clinical hold are being evaluatedWith cash, cash equivalents and investments of $105.2 million as of September 30, 2023, SCYNEXIS projects a cash runway of more than two years JERSEY CITY, N.J., Nov. 13, 2023 (GLOBE NEWSWIRE) -- SCYNEXIS, Inc. (NASDAQ: SCYX), a biote |
SCYNEXIS Presents New Preclinical Data on Second Generation Fungerp SCY-247 at the 11th Congress on Trends in Medical Mycology (TIMM)JERSEY CITY, N.J., Oct. 24, 2023 (GLOBE NEWSWIRE) -- SCYNEXIS, Inc. (NASDAQ: SCYX), a biotechnology company pioneering innovative medicines to overcome and prevent difficult-to-treat and drug-resistant infections, today announced the presentation of preclinical data on its second generation fungerp candidate, SCY-247, against a broad panel of fungal pathogens. The analyses were presented by Mahmoud Ghannoum, Ph.D, Professor and Director Center for Medical Mycology, Case Western Reserve Universit |
SCYNEXIS to Present Preclinical Data on Second Generation Fungerp SCY-247 at the 11th Congress on Trends in Medical Mycology (TIMM) October 20-23 in Athens, GreeceJERSEY CITY, N.J., Oct. 16, 2023 (GLOBE NEWSWIRE) -- SCYNEXIS, Inc. (NASDAQ: SCYX), a biotechnology company pioneering innovative medicines to overcome and prevent difficult-to-treat and drug-resistant infections, today announced the presentation of preclinical data on its second generation fungerp candidate SCY-247 against a broad panel of fungal pathogens, including echinocandin-resistant Candida and Aspergillus, in an oral presentation at the 11th Congress on Trends in Medical Mycology (TIMM) |
SCYX Price Returns
| 1-mo | 4.98% |
| 3-mo | 37.01% |
| 6-mo | 13.44% |
| 1-year | -24.91% |
| 3-year | -69.42% |
| 5-year | -81.73% |
| YTD | -5.38% |
| 2023 | 42.95% |
| 2022 | -74.43% |
| 2021 | -20.26% |
| 2020 | -15.93% |
| 2019 | 89.58% |
Continue Researching SCYX
Want to do more research on Scynexis Inc's stock and its price? Try the links below:Scynexis Inc (SCYX) Stock Price | Nasdaq
Scynexis Inc (SCYX) Stock Quote, History and News - Yahoo Finance
Scynexis Inc (SCYX) Stock Price and Basic Information | MarketWatch
Loading social stream, please wait...