
SandRidge Energy, Inc. (SD): Price and Financial Metrics
SD Price/Volume Stats
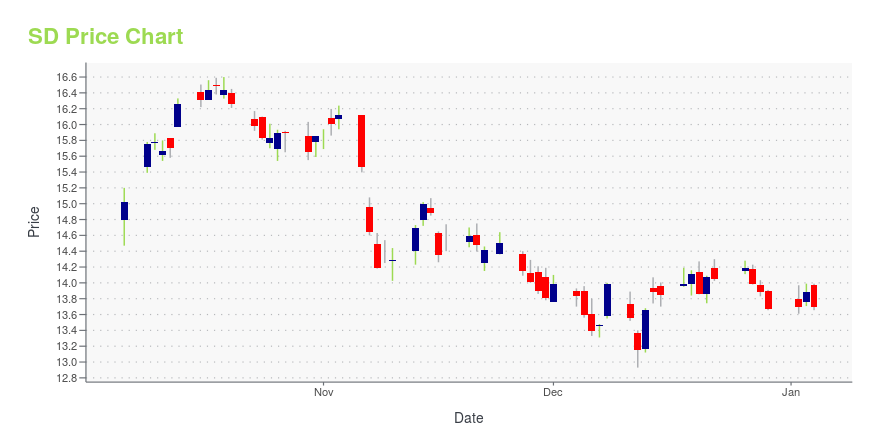
| Current price | $13.33 | 52-week high | $17.19 |
| Prev. close | $13.61 | 52-week low | $11.51 |
| Day low | $13.27 | Volume | 250,490 |
| Day high | $13.65 | Avg. volume | 378,754 |
| 50-day MA | $13.29 | Dividend yield | 3.22% |
| 200-day MA | $13.94 | Market Cap | 494.88M |
SD Stock Price Chart Interactive Chart >
SandRidge Energy, Inc. (SD) Company Bio
SandRidge Energy, Inc., an energy company, engages in the exploration, development, and production of crude oil, natural gas, and natural gas liquids primarily in the area of Mid-Continent in Oklahoma and Kansas. The company is based in Oklahoma City, Oklahoma.
Latest SD News From Around the Web
Below are the latest news stories about SANDRIDGE ENERGY INC that investors may wish to consider to help them evaluate SD as an investment opportunity.
Q3 2023 SandRidge Energy Inc Earnings CallQ3 2023 SandRidge Energy Inc Earnings Call |
SandRidge Energy Inc (SD) Reports Q3 2023 Earnings, Declares $0.10 Per Share Cash DividendCompany sees net income of $18.7 million, adjusted EBITDA of $22.6 million, and free cash flow of $24.2 million for Q3 |
SANDRIDGE ENERGY, INC. ANNOUNCES FINANCIAL AND OPERATING RESULTS FOR THE THREE AND NINE-MONTH PERIODS ENDED SEPTEMBER 30, 2023, DECLARES $0.10 PER SHARE CASH DIVIDEND, AND PROVIDES CONFERENCE CALL INFORMATIONSandRidge Energy, Inc. (the "Company" or "SandRidge") (NYSE: SD) today announced financial and operational results for the three and nine-month periods ended September 30, 2023. |
With 58% ownership of the shares, SandRidge Energy, Inc. (NYSE:SD) is heavily dominated by institutional ownersKey Insights Institutions' substantial holdings in SandRidge Energy implies that they have significant influence over... |
Those who invested in SandRidge Energy (NYSE:SD) three years ago are up 734%Investing can be hard but the potential fo an individual stock to pay off big time inspires us. But when you hold the... |
SD Price Returns
| 1-mo | 3.98% |
| 3-mo | -7.65% |
| 6-mo | -8.05% |
| 1-year | -15.81% |
| 3-year | 138.05% |
| 5-year | 110.79% |
| YTD | -0.92% |
| 2023 | -18.18% |
| 2022 | 62.81% |
| 2021 | 237.43% |
| 2020 | -26.89% |
| 2019 | -44.28% |
SD Dividends
| Ex-Dividend Date | Type | Payout Amount | Change | ||||||
|---|---|---|---|---|---|---|---|---|---|
| Loading, please wait... | |||||||||
Continue Researching SD
Want to do more research on Sandridge Energy Inc's stock and its price? Try the links below:Sandridge Energy Inc (SD) Stock Price | Nasdaq
Sandridge Energy Inc (SD) Stock Quote, History and News - Yahoo Finance
Sandridge Energy Inc (SD) Stock Price and Basic Information | MarketWatch
Loading social stream, please wait...