
SmileDirectClub Inc. (SDC): Price and Financial Metrics
SDC Price/Volume Stats
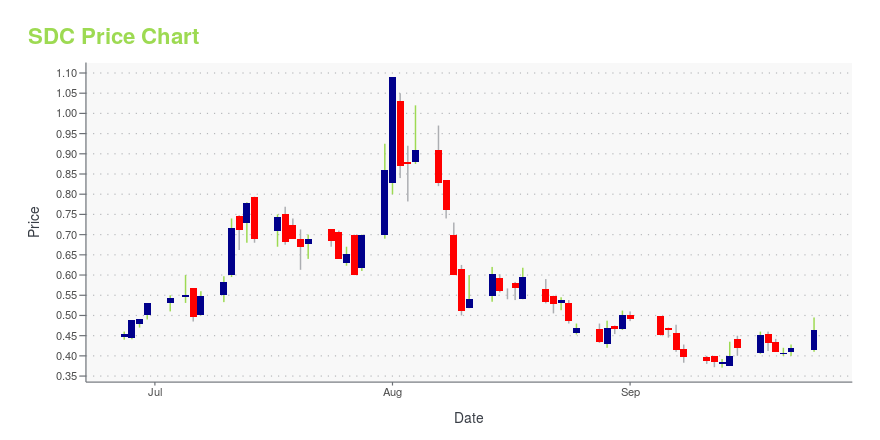
| Current price | $0.08 | 52-week high | $1.09 |
| Prev. close | $0.16 | 52-week low | $0.07 |
| Day low | $0.07 | Volume | 65,738,500 |
| Day high | $0.12 | Avg. volume | 2,586,345 |
| 50-day MA | $0.53 | Dividend yield | N/A |
| 200-day MA | $0.49 | Market Cap | 30.20M |
SDC Stock Price Chart Interactive Chart >
SmileDirectClub Inc. (SDC) Company Bio
SmileDirectClub, Inc. provides dental services. Its clear aligner treatment addresses the large and underserved global orthodontics market. The company was founded by Alexander Fenkell and Jordan Katzman in 2014 and is headquartered in Nashville, TN.
Latest SDC News From Around the Web
Below are the latest news stories about SMILEDIRECTCLUB INC that investors may wish to consider to help them evaluate SDC as an investment opportunity.
SmileDirectClub stock plunges on bankruptcy filingMore on SmileDirectClub |
SmileDirectClub Files for Bankruptcy, Capping Years of Losses(Bloomberg) -- Dental aligner company SmileDirectClub Inc. filed for bankruptcy four years after raising $1.35 billion in an initial public offering. Most Read from BloombergSenate Poised to Act on Bill Averting US Government ShutdownEurope’s Richest Royal Family Builds $300 Billion Finance EmpirePakistan Rupee Set to Become Top Performing Currency Globally Weight-Loss Drugs Estimated to Save Airlines MillionsMurder Claim in Canada Is Only Helping India Leader Modi at HomeThe Chapter 11 filing i |
SmileDirectClub Seeks to Execute Comprehensive Recapitalization to Strengthen the Business for Sustainable GrowthCompany Intends to Maintain Normal Operations, Transforming Smiles Without DisruptionNASHVILLE, Tenn., Sept. 29, 2023 (GLOBE NEWSWIRE) -- SmileDirectClub, Inc. (Nasdaq: SDC), the next generation oral care Company with the first medtech platform for teeth straightening, today announced a process to implement a comprehensive recapitalization transaction. The additional capital and stronger financial position from this recapitalization is intended to bolster the Company’s balance sheet and fuel gro |
Yahoo Finance exclusive: SmileDirectClub files for Chapter 11 bankruptcy, eyes restructuringSmileDirectClub buckles under the weight of several obstacles. |
Here's Why You Should Retain SmileDirectClub (SDC) Stock for NowInvestors are optimistic about SmileDirectClub (SDC) on the latest technology enhancements and upbeat guidance. |
SDC Price Returns
| 1-mo | N/A |
| 3-mo | N/A |
| 6-mo | N/A |
| 1-year | -86.69% |
| 3-year | -98.80% |
| 5-year | N/A |
| YTD | N/A |
| 2023 | 0.00% |
| 2022 | -85.01% |
| 2021 | -80.32% |
| 2020 | 36.61% |
| 2019 | N/A |
Loading social stream, please wait...