Schrodinger Inc. (SDGR): Price and Financial Metrics

Schrodinger Inc. (SDGR): $28.27

0.89 (+3.25%)

POWR Rating

Component Grades

Momentum

C

Stability

D

Sentiment

Quality

C

Add SDGR to Watchlist
Sign Up

Industry: Medical - Services

Industry

C

Ranked

#60 of 69

in industry

SDGR Price/Volume Stats

Current price $28.27 52-week high $59.24
Prev. close $27.38 52-week low $15.85
Day low $27.73 Volume 1,186,000
Day high $28.48 Avg. volume 957,296
50-day MA $37.24 Dividend yield N/A
200-day MA $31.79 Market Cap 2.03B

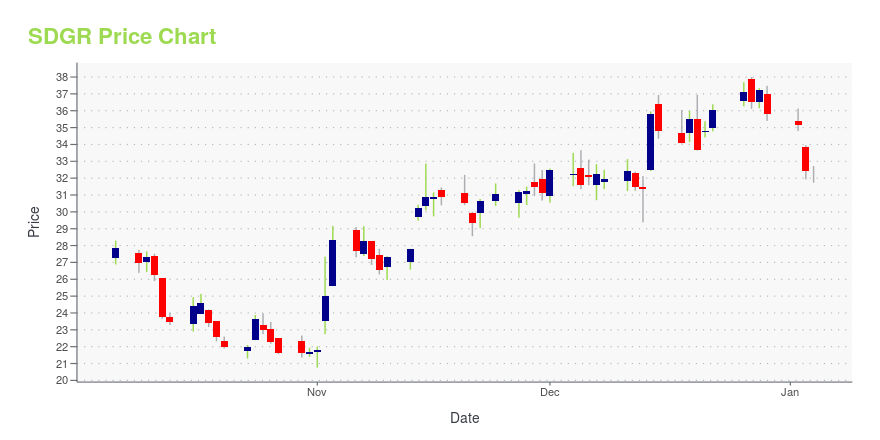
SDGR Stock Price Chart Interactive Chart >

SDGR POWR Grades

  • Quality is the dimension where SDGR ranks best; there it ranks ahead of 73.09% of US stocks.
  • The strongest trend for SDGR is in Stability, which has been heading down over the past 177 days.
  • SDGR ranks lowest in Growth; there it ranks in the 1st percentile.

SDGR Stock Summary

  • SDGR's price/sales ratio is 10.77; that's higher than the P/S ratio of 91.03% of US stocks.
  • In terms of twelve month growth in earnings before interest and taxes, SCHRODINGER INC is reporting a growth rate of -149.02%; that's higher than just 9.57% of US stocks.
  • The volatility of SCHRODINGER INC's share price is greater than that of 85.43% US stocks with at least 200 days of trading history.
  • Stocks with similar financial metrics, market capitalization, and price volatility to SCHRODINGER INC are AKTS, AIP, LQDA, CYN, and PSNL.
  • Visit SDGR's SEC page to see the company's official filings. To visit the company's web site, go to www.schrodinger.com.

SDGR Valuation Summary

  • SDGR's EV/EBIT ratio is 26.5; this is 128.45% higher than that of the median Healthcare stock.
  • Over the past 44 months, SDGR's price/sales ratio has gone down 14.8.

Below are key valuation metrics over time for SDGR.

Stock Date P/S P/B P/E EV/EBIT
SDGR 2023-09-22 10.8 3.4 31.4 26.5
SDGR 2023-09-21 11.0 3.5 32.2 27.2
SDGR 2023-09-20 11.4 3.6 33.3 28.2
SDGR 2023-09-19 11.6 3.7 33.8 28.7
SDGR 2023-09-18 11.8 3.7 34.4 29.2
SDGR 2023-09-15 12.3 3.9 35.8 30.5

SDGR's Quality Factors

The “Quality” component of the POWR Ratings focuses on 31 different factors of a companies fundamentals and operational strength. Here are some key insights as we drill into the specifics of these quality attributes.
  • SDGR has a Quality Grade of C, ranking ahead of 26.23% of graded US stocks.
  • SDGR's asset turnover comes in at 0.167 -- ranking 212th of 681 Pharmaceutical Products stocks.
  • 500 - Internal server error

The table below shows SDGR's key quality metrics over time.

Period Asset Turnover Gross Margin ROIC
2021-06-30 0.167 0.517 -0.083
2021-03-31 0.181 0.561 -0.025
2020-12-31 0.203 0.587 -0.074
2020-09-30 0.263 0.595 -0.086
2020-06-30 0.376 0.583 -0.243
2019-12-31 0.620 0.574 -0.435

SDGR Price Target

For more insight on analysts targets of SDGR, see our SDGR price target page. And for a list of of all stocks sorted by upside potential based on analyst target price, see our Top Price Target page.

Average Price Target $87.60 Average Broker Recommendation 1.33 (Strong Buy)

Schrodinger Inc. (SDGR) Company Bio


Schrödinger, Inc. provides chemical simulation software solutions to pharmaceutical industry. It operates through the Software and Drug Discovery business segments. The Software segment sells software to transform drug discovery across the life sciences industry, as well as to customers in materials science industries. The Drug Discovery segment offers diverse portfolio of preclinical and clinical programs, internally and through collaborations, that have advanced to various stages of discovery and development


SDGR Latest News Stream


Event/Time News Detail
Loading, please wait...

SDGR Latest Social Stream


Loading social stream, please wait...

View Full SDGR Social Stream

Latest SDGR News From Around the Web

Below are the latest news stories about SCHRODINGER INC that investors may wish to consider to help them evaluate SDGR as an investment opportunity.

3 Publicly Traded Companies Most at Risk of an AI Smackdown

Investors should definitely look to sell these three companies at risk from AI.

Larry Ramer on InvestorPlace | September 28, 2023

This AI Biotech Stock Is Already Profitable. Should You Buy It?

As you may have heard amid the recent hype surrounding artificial intelligence (AI), Schrödinger (NASDAQ: SDGR) is one of the leading biotech companies using machine learning and AI to discover new drugs, and it might be the only one with a claim to being profitable in this pursuit. Before you buy shares of Schrödinger, it's important to recognize that its top- and bottom-line growth are far from assured in the near-term. The company's approach is to discover new candidates for further development using both artificial intelligence and adjacent techniques like machine learning, as well as simulation-based modeling of physical interactions between biological targets and potentially therapeutic molecules.

Yahoo | September 28, 2023

Schrödinger and Two City University of New York Colleges Awarded $1M NSF Grant to Increase Access to Computational Molecular Modeling Education

NEW YORK, September 28, 2023--Schrödinger and two CUNY institutions received a 3-year, $1M grant from the NSF to develop learning opportunities for students in molecular modeling.

Yahoo | September 28, 2023

Qiming Venture Partners' portfolio company Tuhu Car Successfully Listed on the Hong Kong Stock Exchange

Qiming Venture Partners' portfolio company Tuhu Car, China's leading one-stop car service platform, successfully listed on the Hong Kong Stock Exchange. The issue price of Tuhu Car (SEHK:9690) was HK$28 per share, representing a market capitalization of about HK$ Billion 22.75.

Yahoo | September 26, 2023

3 Artificial Intelligence (AI) Stocks That Could Soar More Than Nvidia, According to Wall Street

None of these stocks have outperformed Nvidia so far this year. But the next 12 months could be a different story.

Yahoo | September 25, 2023

Read More 'SDGR' Stories Here

SDGR Price Returns

1-mo -22.99%
3-mo N/A
6-mo 5.56%
1-year 13.17%
3-year -44.94%
5-year N/A
YTD 51.26%
2022 -46.34%
2021 -56.01%
2020 N/A
2019 N/A
2018 N/A

Get Free Updates

Join thousands of investors who get the latest news, insights and top rated picks from StockNews.com!