SeaWorld Entertainment, Inc. (SEAS): Price and Financial Metrics
SEAS Price/Volume Stats
Current price | $50.30 | 52-week high | $68.19 |
Prev. close | $49.08 | 52-week low | $40.87 |
Day low | $48.87 | Volume | 504,300 |
Day high | $50.41 | Avg. volume | 727,438 |
50-day MA | $50.74 | Dividend yield | N/A |
200-day MA | $51.00 | Market Cap | 3.22B |
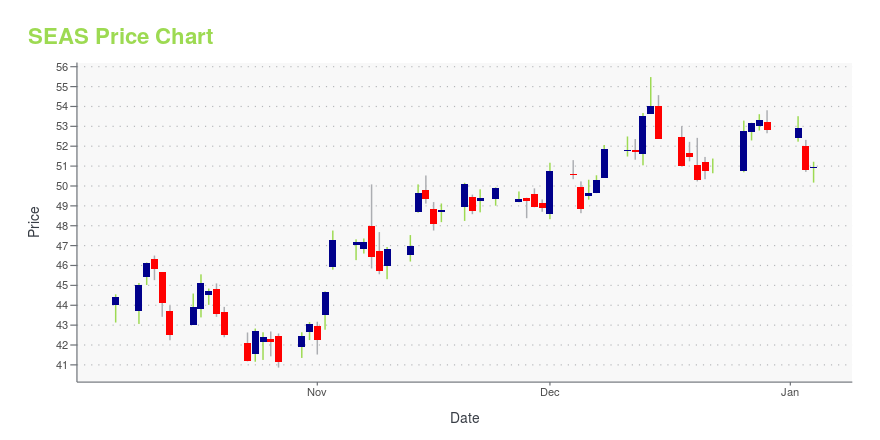
SEAS Stock Price Chart Interactive Chart >
SEAS POWR Grades
- Quality is the dimension where SEAS ranks best; there it ranks ahead of 93.34% of US stocks.
- The strongest trend for SEAS is in Value, which has been heading down over the past 26 weeks.
- SEAS ranks lowest in Sentiment; there it ranks in the 9th percentile.
SEAS Stock Summary
- The capital turnover (annual revenue relative to shareholder's equity) for SEAS is -6.85 -- better than just 2.26% of US stocks.
- For SEAS, its debt to operating expenses ratio is greater than that reported by 85.18% of US equities we're observing.
- Equity multiplier, or assets relative to shareholders' equity, comes in at -6.41 for SEAWORLD ENTERTAINMENT INC; that's greater than it is for only 3.18% of US stocks.
- Stocks with similar financial metrics, market capitalization, and price volatility to SEAWORLD ENTERTAINMENT INC are FUN, SIX, PRTH, NEPT, and HLF.
- Visit SEAS's SEC page to see the company's official filings. To visit the company's web site, go to seaworldentertainment.com.
SEAS Valuation Summary
- SEAS's price/sales ratio is 2; this is 150% higher than that of the median Consumer Cyclical stock.
- SEAS's price/sales ratio has moved down 0.4 over the prior 129 months.
Below are key valuation metrics over time for SEAS.
Stock | Date | P/S | P/B | P/E | EV/EBIT |
---|---|---|---|---|---|
SEAS | 2023-12-29 | 2.0 | -13.4 | 13.9 | 11.4 |
SEAS | 2023-12-28 | 2.0 | -13.5 | 14.0 | 11.5 |
SEAS | 2023-12-27 | 2.0 | -13.5 | 14.0 | 11.4 |
SEAS | 2023-12-26 | 2.0 | -13.4 | 13.9 | 11.4 |
SEAS | 2023-12-22 | 1.9 | -12.9 | 13.3 | 11.1 |
SEAS | 2023-12-21 | 1.9 | -12.9 | 13.3 | 11.1 |
SEAS Growth Metrics
- Its 4 year cash and equivalents growth rate is now at 480.31%.
- Its 3 year price growth rate is now at 122.63%.
- Its 3 year revenue growth rate is now at 16.49%.
The table below shows SEAS's growth in key financial areas (numbers in millions of US dollars).
Date | Revenue | Operating Cash Flow | Net Income to Common Stock |
---|---|---|---|
2022-09-30 | 1,711.537 | 555.449 | 313.718 |
2022-06-30 | 1,667.536 | 554.568 | 281.258 |
2022-03-31 | 1,602.503 | 555.413 | 292.41 |
2021-12-31 | 1,503.73 | 503.012 | 256.513 |
2021-09-30 | 1,286.985 | 403.357 | 139.439 |
2021-06-30 | 871.896 | 195.675 | -41.895 |
SEAS's Quality Factors
The “Quality” component of the POWR Ratings focuses on 31 different factors of a companies fundamentals and operational strength. Here are some key insights as we drill into the specifics of these quality attributes.- SEAS has a Quality Grade of B, ranking ahead of 90.4% of graded US stocks.
- SEAS's asset turnover comes in at 0.33 -- ranking 23rd of 44 Entertainment stocks.
- MCS, LYV, and MTN are the stocks whose asset turnover ratios are most correlated with SEAS.
The table below shows SEAS's key quality metrics over time.
Period | Asset Turnover | Gross Margin | ROIC |
---|---|---|---|
2021-06-30 | 0.330 | 0.389 | 0.017 |
2021-03-31 | 0.174 | 0.107 | -0.053 |
2020-12-31 | 0.169 | 0.015 | -0.064 |
2020-09-30 | 0.231 | 0.162 | -0.061 |
2020-06-30 | 0.394 | 0.369 | -0.003 |
2020-03-31 | 0.572 | 0.446 | 0.055 |
SeaWorld Entertainment, Inc. (SEAS) Company Bio
Seaworld Entertainment operates as a theme park and entertainment company in the United States, with its flagship location being Seaworld in Orlando, Florida. The company was founded in 1959 and is based in Orlando, Florida.
Latest SEAS News From Around the Web
Below are the latest news stories about SEAWORLD ENTERTAINMENT INC that investors may wish to consider to help them evaluate SEAS as an investment opportunity.
Will Theme Park Stocks Bounce Back in 2024?All but one of the major theme park operators lost to the market in 2023. Next year should be better. |
Those who invested in SeaWorld Entertainment (NYSE:SEAS) five years ago are up 85%Generally speaking the aim of active stock picking is to find companies that provide returns that are superior to the... |
Here's What to Expect From Johnson Outdoors' (JOUT) Q4 EarningsElevated retail inventories and warranty expenses and advertising and promotion costs are likely to have dented Johnson Outdoors' (JOUT) Q4 performance. |
SeaWorld Entertainment, Inc. (NYSE:SEAS) Q3 2023 Earnings Call TranscriptSeaWorld Entertainment, Inc. (NYSE:SEAS) Q3 2023 Earnings Call Transcript November 8, 2023 SeaWorld Entertainment, Inc. beats earnings expectations. Reported EPS is $1.92, expectations were $1.91. Operator: Good morning, and welcome to the SeaWorld Parks and Entertainment Q3 2023 Earnings Conference Call. [Operator Instructions] Please note, this event is being recorded. I would now like to […] |
SeaWorld's (SEAS) Q3 Earnings Meet, Revenues Beat, Down Y/YSeaWorld's (SEAS) third-quarter 2023 results reflect a decline in admissions and adverse weather impacts, especially during its peak operating season. |
SEAS Price Returns
1-mo | N/A |
3-mo | -4.79% |
6-mo | 8.76% |
1-year | -14.88% |
3-year | -0.20% |
5-year | 95.26% |
YTD | -4.79% |
2023 | -1.27% |
2022 | -17.50% |
2021 | 105.32% |
2020 | -0.38% |
2019 | 43.55% |
Continue Researching SEAS
Want to see what other sources are saying about SeaWorld Entertainment Inc's financials and stock price? Try the links below:SeaWorld Entertainment Inc (SEAS) Stock Price | Nasdaq
SeaWorld Entertainment Inc (SEAS) Stock Quote, History and News - Yahoo Finance
SeaWorld Entertainment Inc (SEAS) Stock Price and Basic Information | MarketWatch
Loading social stream, please wait...