SeaWorld Entertainment, Inc. (SEAS): Price and Financial Metrics
SEAS Price/Volume Stats
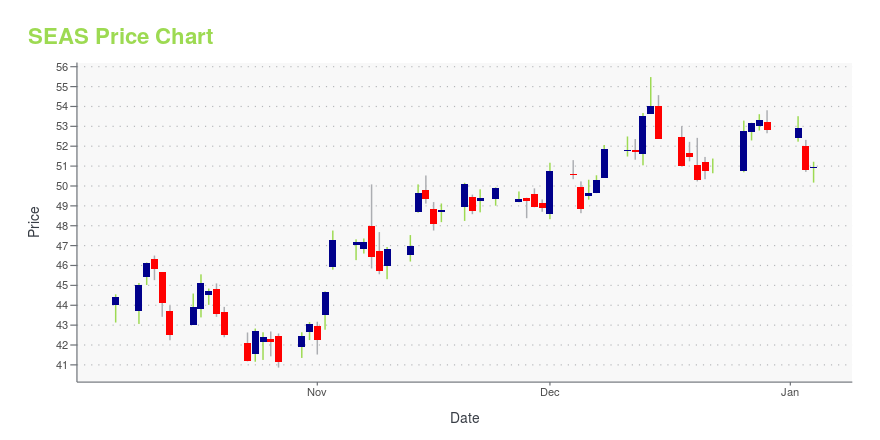
Current price | $47.01 | 52-week high | $68.19 |
Prev. close | $47.01 | 52-week low | $44.38 |
Day low | $46.84 | Volume | 530,800 |
Day high | $47.78 | Avg. volume | 813,843 |
50-day MA | $50.56 | Dividend yield | N/A |
200-day MA | $56.11 | Market Cap | 3.01B |
SEAS Stock Price Chart Interactive Chart >
SEAS POWR Grades
- Quality is the dimension where SEAS ranks best; there it ranks ahead of 96.1% of US stocks.
- SEAS's strongest trending metric is Sentiment; it's been moving down over the last 179 days.
- SEAS ranks lowest in Sentiment; there it ranks in the 6th percentile.
SEAS Stock Summary
- SEAWORLD ENTERTAINMENT INC's capital turnover -- a measure of revenue relative to shareholder's equity -- is better than just 3.05% of US listed stocks.
- The ratio of debt to operating expenses for SEAWORLD ENTERTAINMENT INC is higher than it is for about 85.38% of US stocks.
- SEAS's equity multiplier -- a measure of assets relative to shareholders'equity -- is greater than that of just 3.15% of US stocks.
- Stocks with similar financial metrics, market capitalization, and price volatility to SEAWORLD ENTERTAINMENT INC are PRTH, TGI, WLFC, WEN, and SPH.
- Visit SEAS's SEC page to see the company's official filings. To visit the company's web site, go to seaworldentertainment.com.
SEAS Valuation Summary
- In comparison to the median Consumer Cyclical stock, SEAS's EV/EBIT ratio is 25.8% lower, now standing at 10.5.
- SEAS's price/sales ratio has moved down 0.7 over the prior 126 months.
Below are key valuation metrics over time for SEAS.
Stock | Date | P/S | P/B | P/E | EV/EBIT |
---|---|---|---|---|---|
SEAS | 2023-09-13 | 1.7 | -8.0 | 12.0 | 10.5 |
SEAS | 2023-09-12 | 1.8 | -8.1 | 12.0 | 10.6 |
SEAS | 2023-09-11 | 1.8 | -8.1 | 12.1 | 10.6 |
SEAS | 2023-09-08 | 1.8 | -8.2 | 12.2 | 10.7 |
SEAS | 2023-09-07 | 1.8 | -8.2 | 12.2 | 10.6 |
SEAS | 2023-09-06 | 1.8 | -8.2 | 12.2 | 10.7 |
SEAS Growth Metrics
- Its 4 year cash and equivalents growth rate is now at 480.31%.
- Its 3 year price growth rate is now at 122.63%.
- Its 3 year revenue growth rate is now at 16.49%.

The table below shows SEAS's growth in key financial areas (numbers in millions of US dollars).
Date | Revenue | Operating Cash Flow | Net Income to Common Stock |
---|---|---|---|
2022-09-30 | 1,711.537 | 555.449 | 313.718 |
2022-06-30 | 1,667.536 | 554.568 | 281.258 |
2022-03-31 | 1,602.503 | 555.413 | 292.41 |
2021-12-31 | 1,503.73 | 503.012 | 256.513 |
2021-09-30 | 1,286.985 | 403.357 | 139.439 |
2021-06-30 | 871.896 | 195.675 | -41.895 |
SEAS's Quality Factors
The “Quality” component of the POWR Ratings focuses on 31 different factors of a companies fundamentals and operational strength. Here are some key insights as we drill into the specifics of these quality attributes.- SEAS has a Quality Grade of B, ranking ahead of 90.4% of graded US stocks.
- SEAS's asset turnover comes in at 0.33 -- ranking 23rd of 44 Entertainment stocks.
- MCS, LYV, and MTN are the stocks whose asset turnover ratios are most correlated with SEAS.
The table below shows SEAS's key quality metrics over time.
Period | Asset Turnover | Gross Margin | ROIC |
---|---|---|---|
2021-06-30 | 0.330 | 0.389 | 0.017 |
2021-03-31 | 0.174 | 0.107 | -0.053 |
2020-12-31 | 0.169 | 0.015 | -0.064 |
2020-09-30 | 0.231 | 0.162 | -0.061 |
2020-06-30 | 0.394 | 0.369 | -0.003 |
2020-03-31 | 0.572 | 0.446 | 0.055 |
SeaWorld Entertainment, Inc. (SEAS) Company Bio
Seaworld Entertainment operates as a theme park and entertainment company in the United States, with its flagship location being Seaworld in Orlando, Florida. The company was founded in 1959 and is based in Orlando, Florida.
Latest SEAS News From Around the Web
Below are the latest news stories about SEAWORLD ENTERTAINMENT INC that investors may wish to consider to help them evaluate SEAS as an investment opportunity.
The Ultimate Stocks to Buy: 7 Top-Rated, Options-Backed and Wall Street-Approved PicksAs investors navigate market volatility, these companies stand out as top-rated stocks to buy, offering upside for the daring investor. |
SeaWorld Entertainment Inc CEO Marc Swanson Sells 4,000 SharesOn September 7, 2023, Marc Swanson, the CEO of SeaWorld Entertainment Inc (NYSE:SEAS), sold 4,000 shares of the company. |
SeaWorld Entertainment, Inc. (NYSE:SEAS) Shares Could Be 42% Below Their Intrinsic Value EstimateKey Insights The projected fair value for SeaWorld Entertainment is US$83.48 based on 2 Stage Free Cash Flow to Equity... |
New Survey Shows a Supreme Scream is What Americans Need Now; SeaWorld's Howl-O-Scream Event is the Remedy Offering More Unexpected Screams than Ever BeforeSeaWorld's Howl-O-Scream is the screamiest event for scare seekers this Halloween season… and it may be just what Americans need now. A new survey confirms what experts already know: screaming is actually good for you. Howl-O-Scream events beginning this September coast to coast at SeaWorld can be the remedy with terror-inducing haunts designed to provoke more screams than ever before. |
Disney World Rival Is Brilliant or Desperate With New Marketing TrickSeaWorld Entertainment (NYSE: SEAS) went to some pretty desperate promotional lengths to keep its turnstiles clicking in the second quarter. The new Weather-Or-Not guarantee isn't the only sea otter that SeaWorld is pulling out of its hat this month. |
SEAS Price Returns
1-mo | -3.05% |
3-mo | -15.30% |
6-mo | -16.52% |
1-year | -1.86% |
3-year | 146.00% |
5-year | 57.49% |
YTD | -12.15% |
2022 | -17.50% |
2021 | 105.32% |
2020 | -0.38% |
2019 | 43.55% |
2018 | 62.79% |
Continue Researching SEAS
Want to see what other sources are saying about SeaWorld Entertainment Inc's financials and stock price? Try the links below:SeaWorld Entertainment Inc (SEAS) Stock Price | Nasdaq
SeaWorld Entertainment Inc (SEAS) Stock Quote, History and News - Yahoo Finance
SeaWorld Entertainment Inc (SEAS) Stock Price and Basic Information | MarketWatch
Loading social stream, please wait...