Selecta Biosciences, Inc. (SELB): Price and Financial Metrics
GET POWR RATINGS... FREE!
SELB POWR Grades
- SELB scores best on the Value dimension, with a Value rank ahead of 95.05% of US stocks.
- SELB's strongest trending metric is Growth; it's been moving down over the last 179 days.
- SELB ranks lowest in Growth; there it ranks in the 8th percentile.
SELB Stock Summary
- Of note is the ratio of SELECTA BIOSCIENCES INC's sales and general administrative expense to its total operating expenses; just 10.22% of US stocks have a lower such ratio.
- Over the past twelve months, SELB has reported earnings growth of -228.18%, putting it ahead of just 6.92% of US stocks in our set.
- Revenue growth over the past 12 months for SELECTA BIOSCIENCES INC comes in at 84.7%, a number that bests 90.04% of the US stocks we're tracking.
- Stocks with similar financial metrics, market capitalization, and price volatility to SELECTA BIOSCIENCES INC are QURE, BLCM, RAPT, BPMC, and SGMO.
- SELB's SEC filings can be seen here. And to visit SELECTA BIOSCIENCES INC's official web site, go to selectabio.com.
SELB Valuation Summary
- In comparison to the median Healthcare stock, SELB's price/earnings ratio is 70.59% lower, now standing at 6.5.
- SELB's EV/EBIT ratio has moved up 13.3 over the prior 80 months.
Below are key valuation metrics over time for SELB.
Stock | Date | P/S | P/B | P/E | EV/EBIT |
---|---|---|---|---|---|
SELB | 2023-01-30 | 2.2 | 3.2 | 6.5 | 4.4 |
SELB | 2023-01-27 | 2.2 | 3.2 | 6.5 | 4.4 |
SELB | 2023-01-26 | 2.1 | 3.1 | 6.3 | 4.2 |
SELB | 2023-01-25 | 2.1 | 3.1 | 6.3 | 4.2 |
SELB | 2023-01-24 | 2.2 | 3.3 | 6.6 | 4.5 |
SELB | 2023-01-23 | 2.2 | 3.2 | 6.4 | 4.3 |
SELB Growth Metrics
- Its 3 year revenue growth rate is now at 11731.98%.
- Its 2 year revenue growth rate is now at 1520.31%.
- Its year over year cash and equivalents growth rate is now at -9.54%.

The table below shows SELB's growth in key financial areas (numbers in millions of US dollars).
Date | Revenue | Operating Cash Flow | Net Income to Common Stock |
---|---|---|---|
2022-09-30 | 123.919 | -51.242 | 41.725 |
2022-06-30 | 127.636 | -66.341 | 31.724 |
2022-03-31 | 108.026 | -60.113 | 27.688 |
2021-12-31 | 85.077 | -60.382 | -25.687 |
2021-09-30 | 67.091 | -36.172 | -53.372 |
2021-06-30 | 47.31 | 40.211 | -45.207 |
SELB's Quality Factors
The “Quality” component of the POWR Ratings focuses on 31 different factors of a companies fundamentals and operational strength. Here are some key insights as we drill into the specifics of these quality attributes.- SELB has a Quality Grade of B, ranking ahead of 76.01% of graded US stocks.
- SELB's asset turnover comes in at 0.269 -- ranking 167th of 682 Pharmaceutical Products stocks.
- QGEN, ALPN, and TXMD are the stocks whose asset turnover ratios are most correlated with SELB.
The table below shows SELB's key quality metrics over time.
Period | Asset Turnover | Gross Margin | ROIC |
---|---|---|---|
2021-06-30 | 0.269 | 1 | 7.960 |
2021-03-31 | 0.185 | 1 | 57.591 |
2020-12-31 | 0.130 | 1 | -35.918 |
2020-09-30 | 0.102 | 1 | -12.988 |
2020-06-30 | 0.088 | 1 | -11.186 |
2020-03-31 | 0.097 | 1 | -19.349 |
SELB Price Target
For more insight on analysts targets of SELB, see our SELB price target page. And for a list of of all stocks sorted by upside potential based on analyst target price, see our Top Price Target page.
Average Price Target | $8.67 | Average Broker Recommendation | 1.29 (Strong Buy) |
SELB Stock Price Chart Interactive Chart >
SELB Price/Volume Stats
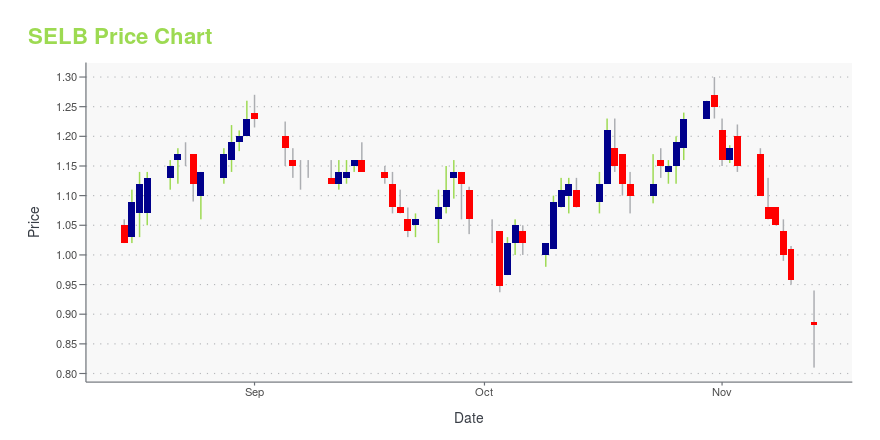
Current price | $1.86 | 52-week high | $2.73 |
Prev. close | $1.83 | 52-week low | $0.65 |
Day low | $1.84 | Volume | 1,079,825 |
Day high | $1.95 | Avg. volume | 793,064 |
50-day MA | $1.37 | Dividend yield | N/A |
200-day MA | $1.45 | Market Cap | 284.64M |
Selecta Biosciences, Inc. (SELB) Company Bio
Selecta Biosciences, Inc., a clinical-stage biotechnology company, develops targeted therapies that use immunomodulators encapsulated in nanoparticles to induce antigen-specific immune responses to prevent and treat disease. The company was founded in 2007 and is based in Watertown, Massachusetts.
Latest SELB News From Around the Web
Below are the latest news stories about SELECTA BIOSCIENCES INC that investors may wish to consider to help them evaluate SELB as an investment opportunity.
Positive week for Selecta Biosciences, Inc. (NASDAQ:SELB) institutional investors who lost 34% over the past yearEvery investor in Selecta Biosciences, Inc. ( NASDAQ:SELB ) should be aware of the most powerful shareholder groups... |
The Petri Dish: Moderna looks at new price tag for Covid vaccineModerna Inc. (Nasdaq: MRNA) is considering hiking the price of its Covid-19 vaccine up by up to 400%. |
Selecta Biosciences Provides Business Update and Outlook for 2023- Expected topline data for Phase 3 DISSOLVE I & II programs of SEL-212 in chronic refractory gout in Q1 2023 - - To receive $10 million upfront for the execution of a license agreement for Xork, the Company’s next-generation immunoglobulin G (IgG) protease candidate, to be developed with Astellas Gene Therapies’ AT845, an investigational product for the treatment of Pompe disease - - Selected an interleukin-2 (IL-2) development candidate to be studied in combination with ImmTOR™ further expandi |
Selecta Biosciences and Astellas Announce Exclusive Licensing and Development Agreement for Xork IgG ProteaseSelecta Biosciences, Inc. (NASDAQ: SELB, President and CEO: Carsten Brunn, Ph.D., "Selecta"), and Astellas Pharma Inc. (TSE: 4503, President and CEO: Kenji Yasukawa, Ph.D., "Astellas" or "Astellas Gene Therapies") today announced an exclusive licensing and development agreement for IdeXork (Xork). Xork is being studied as a potential next generation immunoglobulin G (IgG) protease that will be developed by Astellas for use with AT845, an investigational, adeno-associated virus (AAV)-based treatm |
Shareholders in Selecta Biosciences (NASDAQ:SELB) have lost 89%, as stock drops 19% this past weekLong term investing is the way to go, but that doesn't mean you should hold every stock forever. We really hate to see... |
SELB Price Returns
1-mo | 61.74% |
3-mo | 13.41% |
6-mo | -21.19% |
1-year | -20.85% |
3-year | -48.19% |
5-year | -78.77% |
YTD | 64.60% |
2022 | -65.34% |
2021 | 7.59% |
2020 | 27.31% |
2019 | -10.53% |
2018 | -72.88% |
Loading social stream, please wait...