
Seneca Foods Corp. - (SENEA): Price and Financial Metrics
SENEA Price/Volume Stats
| Current price | $61.74 | 52-week high | $63.77 |
| Prev. close | $61.06 | 52-week low | $34.51 |
| Day low | $60.90 | Volume | 11,700 |
| Day high | $62.00 | Avg. volume | 33,024 |
| 50-day MA | $59.61 | Dividend yield | N/A |
| 200-day MA | $54.81 | Market Cap | 429.96M |
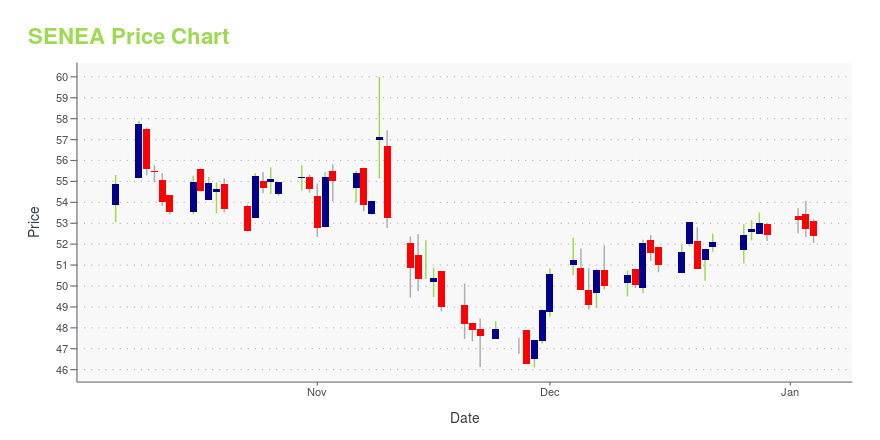
SENEA Stock Price Chart Interactive Chart >
Seneca Foods Corp. - (SENEA) Company Bio
Seneca Foods Corporation produces, packages, and sells packaged fruits and vegetables in the United States and internationally. The company was founded in 1949 and is based in Marion, New York.
Latest SENEA News From Around the Web
Below are the latest news stories about SENECA FOODS CORP that investors may wish to consider to help them evaluate SENEA as an investment opportunity.
Urgent – Food Recall Because of Potential Undeclared Allergen Due to MislabelSeneca Foods Corp. Seneca Foods Corp. Seneca Foods Corp. Seneca Foods Corp. JANESVILLE, Wis., Nov. 21, 2023 (GLOBE NEWSWIRE) -- As a precautionary measure, Seneca Foods Corporation is announcing a voluntary recall of mislabeled Hy-Vee Turkey gravy in glass jars that actually contains beef gravy. This product could potentially contain a soy allergen which is not declared on the label. Seneca is now retrieving improperly labeled Hy-Vee Turkey Gravy from its distribution system. This recall only af |
Seneca Foods Reports Sales and Earnings for the Quarter and Six Months Ended September 30, 2023FAIRPORT, N.Y., Nov. 09, 2023 (GLOBE NEWSWIRE) -- Seneca Foods Corporation (NASDAQ: SENEA, SENEB) today announced financial results for the second quarter and six months ended September 30, 2023. Executive Summary (vs. year-ago, year-to-date results): Net sales for the six months ended September 30, 2023 totaled $706.1 million compared to $705.0 for the six months ended October 1, 2022. The year-over-year increase of $1.1 million was mainly due to higher selling prices partially offset by lower |
B&G Foods sells Green Giant US canned vegetable line to Seneca FoodsThe Crisco and Ortega manufacturer said it continues to explore divesting products that have low margins or cash flow, as well as items that do not fit with its core portfolio. |
Seneca Foods Announces Purchase of Assets Related to the Green Giant U.S. Shelf-Stable BusinessFAIRPORT, N.Y., Nov. 08, 2023 (GLOBE NEWSWIRE) -- Seneca Foods Corporation (NASDAQ: SENEA, SENEB) announced today that it has purchased assets related to the Green Giant U.S. shelf-stable business from B&G Foods. In connection with the sale, the Company has entered into a license agreement for use of the Green Giant brand name for Green Giant shelf-stable products. B&G Foods will retain ownership of the Green Giant trademarks. The sale does not include Green Giant frozen, Green Giant Canada or t |
What Makes Seneca Foods Corp. (SENEA) an Attractive Opportunity?Greystone Capital Management, an investment management company, released its third-quarter 2023 investor letter. A copy of the same can be downloaded here. In the third quarter, the return for separate accounts managed by the firm was -11.4%, net of fees compared to S&P 500’s and Russell 2000’s returns of -3.2% and -5.1%, respectively. Client portfolios are […] |
SENEA Price Returns
| 1-mo | 7.41% |
| 3-mo | 6.65% |
| 6-mo | 12.85% |
| 1-year | 73.82% |
| 3-year | 12.30% |
| 5-year | 105.39% |
| YTD | 17.73% |
| 2023 | -13.96% |
| 2022 | 27.11% |
| 2021 | 20.18% |
| 2020 | -2.18% |
| 2019 | 44.54% |
Continue Researching SENEA
Here are a few links from around the web to help you further your research on Seneca Foods Corp's stock as an investment opportunity:Seneca Foods Corp (SENEA) Stock Price | Nasdaq
Seneca Foods Corp (SENEA) Stock Quote, History and News - Yahoo Finance
Seneca Foods Corp (SENEA) Stock Price and Basic Information | MarketWatch
Loading social stream, please wait...