
Sera Prognostics, Inc., (SERA): Price and Financial Metrics
SERA Price/Volume Stats
| Current price | $8.43 | 52-week high | $12.35 |
| Prev. close | $8.03 | 52-week low | $1.52 |
| Day low | $7.80 | Volume | 123,300 |
| Day high | $8.56 | Avg. volume | 217,755 |
| 50-day MA | $7.51 | Dividend yield | N/A |
| 200-day MA | $6.73 | Market Cap | 275.27M |
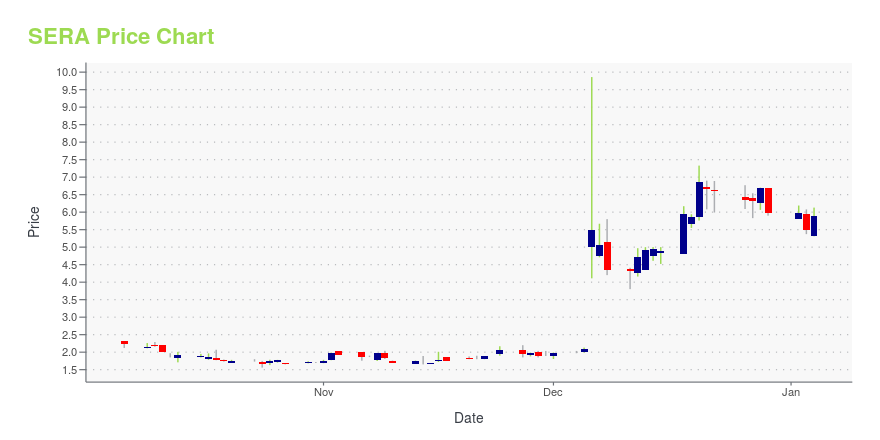
SERA Stock Price Chart Interactive Chart >
Sera Prognostics, Inc., (SERA) Company Bio
Sera Prognostics, Inc., a health diagnostic company, discovers, develops, and commercializes biomarker tests for the early prediction of preterm birth risk and other complications of pregnancy. It develops PreTRM test, a blood-based biomarker test to predict the risk of spontaneous preterm birth in asymptomatic singleton pregnancies. The company was incorporated in 2008 and is headquartered in Salt Lake City, Utah.
Latest SERA News From Around the Web
Below are the latest news stories about SERA PROGNOSTICS INC that investors may wish to consider to help them evaluate SERA as an investment opportunity.
Here's Why Sera Prognostics, Inc. (SERA) is a Great Momentum Stock to BuyDoes Sera Prognostics, Inc. (SERA) have what it takes to be a top stock pick for momentum investors? Let's find out. |
While institutions invested in Sera Prognostics, Inc. (NASDAQ:SERA) benefited from last week's 183% gain, retail investors stood to gain the mostKey Insights Significant control over Sera Prognostics by retail investors implies that the general public has more... |
Stocks Edge Higher On Hopes Of Soft Economic LandingEasing labor costs, rising productivity, and a cooling labor market are supporting Wall Street this afternoon. |
Why Is Sera Prognostics (SERA) Stock Up 260% Today?With an oversight board recommending Sera Prognostics halt its clinical study for efficacy, SERA stock soared on the positive implications. |
SERA PROGNOSTICS ANNOUNCES PRIMARY ENDPOINT CRITERIA MET IN PIVOTAL PRIME STUDY INTERIM LOOK - ENROLLMENT TO STOP DUE TO SUCCESSSera Prognostics Inc., The Pregnancy Company® (Nasdaq: SERA), focused on improving maternal and neonatal health by providing innovative pregnancy biomarker information to doctors and patients, today announced that the Data Safety Monitoring Board (DSMB) overseeing its pivotal Prematurity Risk Assessment Combined with Clinical Interventions for Improved Neonatal OutcoMEs (PRIME) study recommended stopping enrollment due to efficacy, reporting that either of the co-primary endpoints met the stoppi |
SERA Price Returns
| 1-mo | 47.38% |
| 3-mo | -21.58% |
| 6-mo | 22.35% |
| 1-year | 198.94% |
| 3-year | -16.70% |
| 5-year | N/A |
| YTD | 40.97% |
| 2023 | 374.60% |
| 2022 | -81.66% |
| 2021 | N/A |
| 2020 | N/A |
| 2019 | N/A |
Loading social stream, please wait...