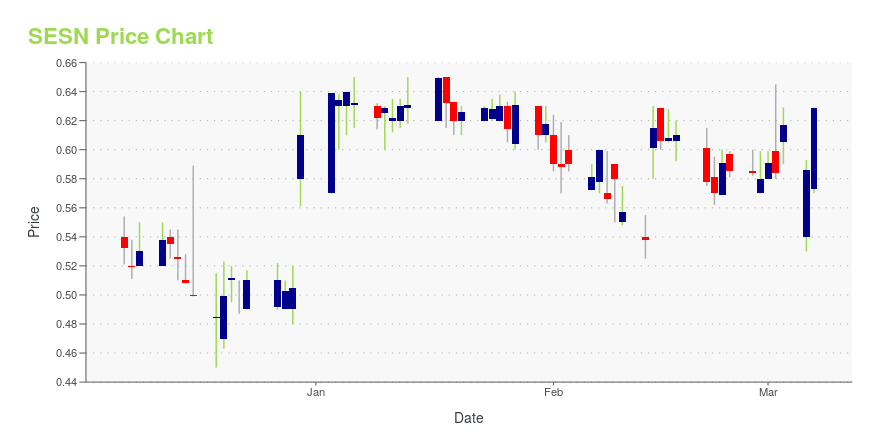
Sesen Bio, Inc. (SESN): Price and Financial Metrics
SESN Price/Volume Stats
| Current price | $12.58 | 52-week high | $12.58 |
| Prev. close | $0.59 | 52-week low | $0.37 |
| Day low | $11.40 | Volume | 93,330 |
| Day high | $12.58 | Avg. volume | 1,067,298 |
| 50-day MA | $0.60 | Dividend yield | N/A |
| 200-day MA | $0.61 | Market Cap | 2.56B |
SESN Stock Price Chart Interactive Chart >
Sesen Bio, Inc. (SESN) Company Bio
Sesen Bio (formerly Eleven Biotherapeutics, Inc.), a biopharmaceutical company, engages in the discovery and development of protein therapeutics to treat eye diseases primarily in the United States. The company was founded in 2008 and is based in Cambridge, Massachusetts.
Latest SESN News From Around the Web
Below are the latest news stories about SESEN BIO INC that investors may wish to consider to help them evaluate SESN as an investment opportunity.
Sesen Bio Stockholders Approve Merger with Carisma TherapeuticsCAMBRIDGE, Mass., March 02, 2023--Sesen Bio, Inc. (Nasdaq: SESN) ("Sesen Bio" or the "Company"), today announced that its stockholders have voted to approve all proposals, including the pending merger with Carisma Therapeutics Inc. ("Carisma"), at the Company’s Special Meeting of Stockholders (the "Special Meeting") held earlier today. |
Sesen Bio Reports Fourth Quarter and Full-Year 2022 Financial ResultsCAMBRIDGE, Mass., February 28, 2023--Sesen Bio (Nasdaq: SESN) today reported operating results for the fourth quarter and full year ended December 31, 2022, and provided a business update. |
Leading Independent Proxy Advisory Firm Glass Lewis Joins ISS in Recommending That Sesen Bio Stockholders Vote "FOR" All Proposals to Approve Pending Merger With CarismaCAMBRIDGE, Mass., February 21, 2023--Sesen Bio, Inc. (Nasdaq: SESN) ("Sesen Bio" or the "Company"), today announced that leading independent proxy advisory firm Glass, Lewis & Co. ("Glass Lewis") recommends that stockholders vote "FOR" all proposals, including the pending merger with Carisma Therapeutics Inc. ("Carisma"), in advance of the Company’s upcoming Special Meeting of Stockholders (the "Special Meeting") scheduled for March 2, 2023. |
Leading Independent Proxy Advisory Firm ISS Recommends Sesen Bio Stockholders Vote "FOR" All Proposals at March 2 Special MeetingCAMBRIDGE, Mass., February 16, 2023--Sesen Bio, Inc. (Nasdaq: SESN) ("Sesen Bio" or the "Company"), today announced that Institutional Shareholder Services ("ISS") recommends that stockholders vote "FOR" all proposals, including the pending merger with Carisma Therapeutics Inc. ("Carisma"), at the Company’s upcoming Special Meeting of Stockholders (the "Special Meeting") scheduled for March 2, 2023. ISS is widely recognized as a leading independent proxy advisory firm, providing impartial analys |
Sesen Bio to Host Webcast with Carisma Therapeutics to Discuss Pending MergerCAMBRIDGE, Mass., February 16, 2023--Sesen Bio, Inc. (Nasdaq: SESN) today announced that members of its management team will host a fireside chat with members of the Carisma Therapeutics Inc. ("Carisma") management team on Tuesday, February 21, 2023, at 8:00 am ET. The discussion will cover Sesen Bio’s pending merger with Carisma, as well as Carisma’s corporate strategy and clinical programs. Sesen Bio stockholders can submit questions in advance to [email protected]. |
SESN Price Returns
| 1-mo | N/A |
| 3-mo | N/A |
| 6-mo | N/A |
| 1-year | N/A |
| 3-year | -83.62% |
| 5-year | -44.82% |
| YTD | N/A |
| 2023 | 0.00% |
| 2022 | -25.21% |
| 2021 | -39.63% |
| 2020 | 29.81% |
| 2019 | -26.76% |


Loading social stream, please wait...