Sprouts Farmers Market, Inc. (SFM): Price and Financial Metrics
GET POWR RATINGS... FREE!
SFM POWR Grades
- Quality is the dimension where SFM ranks best; there it ranks ahead of 98.79% of US stocks.
- The strongest trend for SFM is in Sentiment, which has been heading up over the past 179 days.
- SFM's current lowest rank is in the Sentiment metric (where it is better than 20.91% of US stocks).
SFM Stock Summary
- Sprouts Farmers Market Inc's capital turnover -- a measure of revenue relative to shareholder's equity -- is better than 94.61% of US listed stocks.
- SFM's price/sales ratio is 0.59; that's higher than the P/S ratio of merely 13.52% of US stocks.
- Revenue growth over the past 12 months for Sprouts Farmers Market Inc comes in at -5.7%, a number that bests only 13.18% of the US stocks we're tracking.
- Stocks that are quantitatively similar to SFM, based on their financial statements, market capitalization, and price volatility, are VLGEA, FLO, FOSL, BCC, and MED.
- SFM's SEC filings can be seen here. And to visit Sprouts Farmers Market Inc's official web site, go to www.sprouts.com.
SFM Valuation Summary
- SFM's price/sales ratio is 0.4; this is 71.43% lower than that of the median Consumer Defensive stock.
- SFM's price/sales ratio has moved down 2.8 over the prior 98 months.
Below are key valuation metrics over time for SFM.
Stock | Date | P/S | P/B | P/E | EV/EBIT |
---|---|---|---|---|---|
SFM | 2021-09-03 | 0.4 | 3.0 | 10.3 | 11.0 |
SFM | 2021-09-02 | 0.5 | 3.0 | 10.4 | 11.1 |
SFM | 2021-09-01 | 0.4 | 2.9 | 10.2 | 10.9 |
SFM | 2021-08-31 | 0.5 | 3.0 | 10.4 | 11.1 |
SFM | 2021-08-30 | 0.4 | 3.0 | 10.3 | 11.1 |
SFM | 2021-08-27 | 0.4 | 3.0 | 10.3 | 11.1 |
SFM Growth Metrics
- Its 2 year revenue growth rate is now at 21.7%.
- Its year over year net income to common stockholders growth rate is now at 50.6%.
- The 5 year cash and equivalents growth rate now stands at 69.65%.

The table below shows SFM's growth in key financial areas (numbers in millions of US dollars).
Date | Revenue | Operating Cash Flow | Net Income to Common Stock |
---|---|---|---|
2021-12-31 | 6,099.869 | 364.799 | 244.157 |
2021-09-30 | 6,208.907 | 380.43 | 276.326 |
2021-06-30 | 6,276.872 | 277.992 | 272.7 |
2021-03-31 | 6,397.667 | 322.401 | 278.688 |
2020-12-31 | 6,468.759 | 494.035 | 287.45 |
2020-09-30 | 6,231.916 | 442.162 | 250.687 |
SFM's Quality Factors
The “Quality” component of the POWR Ratings focuses on 31 different factors of a companies fundamentals and operational strength. Here are some key insights as we drill into the specifics of these quality attributes.- SFM has a Quality Grade of A, ranking ahead of 98.55% of graded US stocks.
- SFM's asset turnover comes in at 2.158 -- ranking 39th of 165 Retail stocks.
- TSCO, KR, and BGFV are the stocks whose asset turnover ratios are most correlated with SFM.
The table below shows SFM's key quality metrics over time.
Period | Asset Turnover | Gross Margin | ROIC |
---|---|---|---|
2021-10-03 | 2.158 | 0.365 | 0.122 |
2021-07-04 | 2.209 | 0.368 | 0.120 |
2021-04-04 | 2.235 | 0.371 | 0.122 |
2021-01-03 | 2.268 | 0.368 | 0.126 |
2020-09-27 | 2.201 | 0.363 | 0.108 |
2020-06-28 | 2.156 | 0.353 | 0.094 |
SFM Price Target
For more insight on analysts targets of SFM, see our SFM price target page. And for a list of of all stocks sorted by upside potential based on analyst target price, see our Top Price Target page.
Average Price Target | $24.94 | Average Broker Recommendation | 1.95 (Hold) |
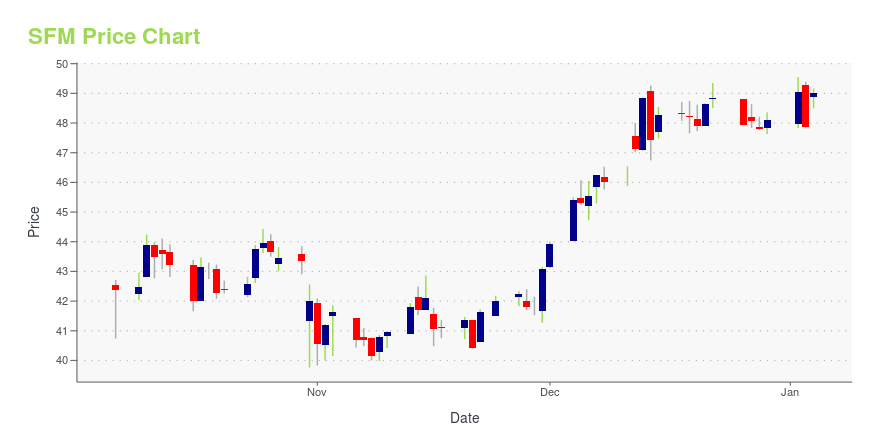
SFM Stock Price Chart Interactive Chart >
SFM Price/Volume Stats
Current price | $24.28 | 52-week high | $35.34 |
Prev. close | $25.62 | 52-week low | $21.18 |
Day low | $24.28 | Volume | 100 |
Day high | $24.28 | Avg. volume | 1,930,890 |
50-day MA | $26.55 | Dividend yield | N/A |
200-day MA | $27.25 | Market Cap | 2.66B |
Sprouts Farmers Market, Inc. (SFM) Company Bio
Sprouts Farmers Market operates as a specialty retailer of fresh, natural, and organic food in the United States. The company was founded in 2002 and is based in Phoenix, Arizona.
Latest SFM News From Around the Web
Below are the latest news stories about Sprouts Farmers Market Inc that investors may wish to consider to help them evaluate SFM as an investment opportunity.
Sprouts Farmers Market, Inc. (SFM) CEO Jack Sinclair on Q4 2021 Results - Earnings Call TranscriptSprouts Farmers Market, Inc. (SFM) Q4 2021 Earnings Conference Call February 24, 2022 17:00 ET Company Participants Susannah Livingston - Vice President of Investor Relations & Treasury Jack Sinclair - Chief Executive Officer Chip Molloy - Chief Financial Officer Conference Call Participants Ken Goldman - JPMorgan Mark Carden - UBS... |
Sprouts Farmers Market, Inc. Announces Appointment of Nicholas Konat as President and Chief Operating OfficerPHOENIX, Feb. 24, 2022 (GLOBE NEWSWIRE) -- Sprouts Farmers Market, Inc. (Nasdaq: SFM) today announced that Nicholas Konat has been appointed as president and chief operating officer of the company, effective March 21, 2022. Konat has most recently served as chief merchandising officer at Petco Health and Wellness Company, Inc. (NASDAQ: WOOF), a leading brand in the U.S. pet care industry and will oversee the company’s operations, marketing, merchandising, and innovation functions and report to J |
Sprouts Farmers Market, Inc. Reports Fourth Quarter and Full Year 2021 ResultsPHOENIX, Feb. 24, 2022 (GLOBE NEWSWIRE) -- Sprouts Farmers Market, Inc. (Nasdaq: SFM) today reported results for the 13-week fourth quarter and 52-week year ending January 2, 2022.Period-over-period comparison stated herein reflect 13 and 52 weeks in the fourth quarter and fiscal year 2021 to 14 and 53 weeks in the fourth quarter and fiscal year 2020, respectively, unless otherwise noted(1). "We are pleased that results for both sales and earnings exceeded our expectations for the quarter and ar |
Is it Still Okay to Invest in Sprouts Farmers Market (SFM)?Silver Ring Value Partners, an investment management firm, published its fourth-quarter 2021 investor letter – a copy of which can be downloaded here. At the end of the fourth quarter of 2021, the portfolio was very attractively priced, with the Price to Base Case value ratio at 54%. The portfolio had 15 investments plus hedges, […] |
Warren Buffett Stocks: GOOGL Stock Among 21 Stocks On This ScreenSee who joins GOOGL stock on this screen of Warren Buffett stocks based on the investing strategy of the Berkshire Hathaway CEO. |
SFM Price Returns
1-mo | -10.37% |
3-mo | -25.15% |
6-mo | -18.19% |
1-year | -2.29% |
3-year | 31.53% |
5-year | 7.10% |
YTD | -18.19% |
2021 | 47.66% |
2020 | 3.88% |
2019 | -17.69% |
2018 | -3.45% |
2017 | 28.70% |
Continue Researching SFM
Want to see what other sources are saying about Sprouts Farmers Market Inc's financials and stock price? Try the links below:Sprouts Farmers Market Inc (SFM) Stock Price | Nasdaq
Sprouts Farmers Market Inc (SFM) Stock Quote, History and News - Yahoo Finance
Sprouts Farmers Market Inc (SFM) Stock Price and Basic Information | MarketWatch
Loading social stream, please wait...