Seattle Genetics, Inc. (SGEN): Price and Financial Metrics
GET POWR RATINGS... FREE!
SGEN POWR Grades
- Value is the dimension where SGEN ranks best; there it ranks ahead of 72.4% of US stocks.
- SGEN's strongest trending metric is Quality; it's been moving down over the last 179 days.
- SGEN ranks lowest in Momentum; there it ranks in the 4th percentile.
SGEN Stock Summary
- The ratio of debt to operating expenses for Seagen Inc is higher than it is for about merely 7.87% of US stocks.
- SGEN's price/sales ratio is 16.7; that's higher than the P/S ratio of 91.52% of US stocks.
- As for revenue growth, note that SGEN's revenue has grown -27.63% over the past 12 months; that beats the revenue growth of only 5.93% of US companies in our set.
- Stocks that are quantitatively similar to SGEN, based on their financial statements, market capitalization, and price volatility, are INCY, QRVO, BGNE, UMC, and WDC.
- SGEN's SEC filings can be seen here. And to visit Seagen Inc's official web site, go to www.seattlegenetics.com.
SGEN Valuation Summary
- SGEN's price/earnings ratio is 51.1; this is 40% higher than that of the median Healthcare stock.
- Over the past 243 months, SGEN's price/sales ratio has gone down 1289.2.
- SGEN's price/earnings ratio has moved up 66.6 over the prior 243 months.
Below are key valuation metrics over time for SGEN.
Stock | Date | P/S | P/B | P/E | EV/EBIT |
---|---|---|---|---|---|
SGEN | 2021-08-31 | 12.8 | 9.0 | 51.1 | 50.3 |
SGEN | 2021-08-30 | 12.9 | 9.0 | 51.4 | 50.6 |
SGEN | 2021-08-27 | 12.7 | 8.9 | 50.8 | 50.1 |
SGEN | 2021-08-26 | 12.9 | 9.1 | 51.5 | 50.7 |
SGEN | 2021-08-25 | 13.0 | 9.1 | 51.7 | 51.0 |
SGEN | 2021-08-24 | 12.8 | 9.0 | 51.2 | 50.4 |
SGEN Growth Metrics
- The 4 year price growth rate now stands at 286.78%.
- Its year over year net cashflow from operations growth rate is now at 555.83%.
- The 2 year net income to common stockholders growth rate now stands at -76.99%.

The table below shows SGEN's growth in key financial areas (numbers in millions of US dollars).
Date | Revenue | Operating Cash Flow | Net Income to Common Stock |
---|---|---|---|
2021-12-31 | 1,574.371 | -499.007 | -674.471 |
2021-09-30 | 1,745.814 | -26.48 | -332.748 |
2021-06-30 | 2,383.485 | 814.141 | 597.266 |
2021-03-31 | 2,273.005 | 800.301 | 660.652 |
2020-12-31 | 2,175.536 | 856.568 | 613.67 |
2020-09-30 | 1,864.047 | 655.573 | 472.405 |
SGEN's Quality Factors
The “Quality” component of the POWR Ratings focuses on 31 different factors of a companies fundamentals and operational strength. Here are some key insights as we drill into the specifics of these quality attributes.- SGEN has a Quality Grade of C, ranking ahead of 74.02% of graded US stocks.
- SGEN's asset turnover comes in at 0.44 -- ranking 102nd of 681 Pharmaceutical Products stocks.
- BPMC, OCGN, and OTLC are the stocks whose asset turnover ratios are most correlated with SGEN.
The table below shows SGEN's key quality metrics over time.
Period | Asset Turnover | Gross Margin | ROIC |
---|---|---|---|
2021-09-30 | 0.440 | 0.836 | -0.133 |
2021-06-30 | 0.640 | 0.882 | 0.271 |
2021-03-31 | 0.693 | 0.889 | 0.354 |
2020-12-31 | 0.773 | 0.900 | 0.398 |
2020-09-30 | 0.788 | 0.910 | 0.374 |
2020-06-30 | 0.475 | 0.901 | -0.184 |
SGEN Price Target
For more insight on analysts targets of SGEN, see our SGEN price target page. And for a list of of all stocks sorted by upside potential based on analyst target price, see our Top Price Target page.
Average Price Target | $188.25 | Average Broker Recommendation | 1.58 (Moderate Buy) |
SGEN Stock Price Chart Interactive Chart >
SGEN Price/Volume Stats
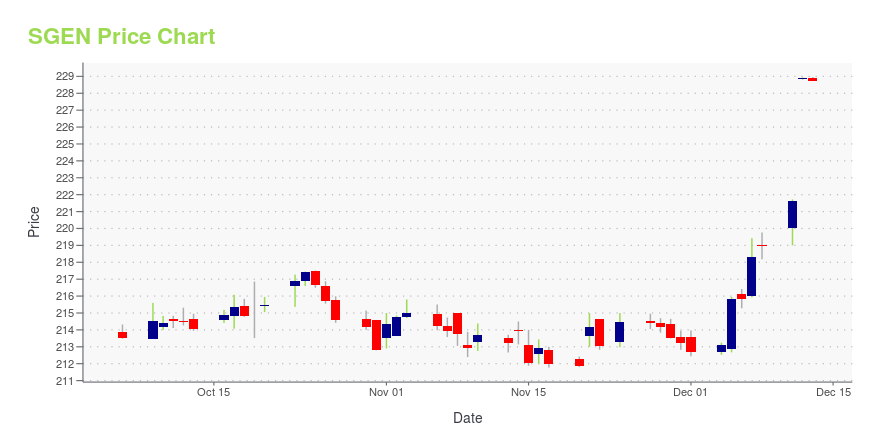
Current price | $142.63 | 52-week high | $192.79 |
Prev. close | $143.00 | 52-week low | $105.43 |
Day low | $139.84 | Volume | 1,023,400 |
Day high | $145.19 | Avg. volume | 1,129,453 |
50-day MA | $139.04 | Dividend yield | N/A |
200-day MA | $150.97 | Market Cap | 26.25B |
Seattle Genetics, Inc. (SGEN) Company Bio
Seattle Genetics is a biotechnology company focused on the development and commercialization of innovative antibody-based therapies for the treatment of cancer. The company was founded in 1998 and is based in Bothell, Washington.
Latest SGEN News From Around the Web
Below are the latest news stories about Seagen Inc that investors may wish to consider to help them evaluate SGEN as an investment opportunity.
Seagen and Genmab Present First Data on Tisotumab Vedotin (TIVDAK®) in Patients with Head and Neck Squamous Cell CarcinomaBOTHELL, Wash., & COPENHAGEN, Denmark, February 24, 2022--Seagen Inc. (Nasdaq: SGEN) and Genmab A/S (Nasdaq: GMAB) will present preliminary data from the innovaTV 207 global, open-label, multicenter phase 2 trial of tisotumab vedotin (TIVDAK®) as a monotherapy in patients with squamous cell carcinoma of the head and neck (SCCHN) who experienced disease progression on or after a first-line platinum-containing regimen and a checkpoint inhibitor. Early results showed tisotumab vedotin demonstrated |
Genmab and Seagen Present First Data on Tisotumab Vedotin (TIVDAK®) in Patients with Head and Neck Squamous Cell CarcinomaCOPENHAGEN, Denmark & BOTHELL, Wash., February 24, 2022--Genmab A/S (Nasdaq: GMAB) and Seagen Inc. (Nasdaq: SGEN) will present preliminary data from the innovaTV 207 global, open-label, multicenter phase 2 trial of tisotumab vedotin (TIVDAK®) as a monotherapy in patients with squamous cell carcinoma of the head and neck (SCCHN) who experienced disease progression on or after a first-line platinum-containing regimen and a checkpoint inhibitor. Early results showed tisotumab vedotin demonstrated a |
Downgrade: Here's How Analysts See Seagen Inc. (NASDAQ:SGEN) Performing In The Near TermOne thing we could say about the analysts on Seagen Inc. ( NASDAQ:SGEN ) - they aren't optimistic, having just made a... |
Berenberg Bank Thinks Seagen’s Stock is Going to RecoverIn a report released today, Zhiqiang Shu from Berenberg Bank maintained a Buy rating on Seagen (SGEN – Research Report), with a price target of $180.00. The company's shares closed last Monday at $124.51, close to its 52-week low of $118.00. According to TipRanks.com, Shu has 0 stars on 0-5 stars ranking scale with an average return of -25.1% and a 14.4% success rate. Shu covers the Healthcare sector, focusing on stocks such as Monte Rosa Therapeutics, Sensei Biotherapeutics, and Sarepta Therapeutics. Seagen has an analyst consensus of Moderate Buy, with a price target consensus of $161.14, which is a 29.2% upside from current levels. |
Leerink Partners Thinks Seagen’s Stock is Going to RecoverLeerink Partners analyst Andrew Berens maintained a Buy rating on Seagen (SGEN – Research Report) today. The company's shares closed last Tuesday at $128.17, close to its 52-week low of $118.00. According to TipRanks.com, Berens has currently 0 stars on a ranking scale of 0-5 stars, with an average return of -8.9% and a 42.2% success rate. Berens covers the Healthcare sector, focusing on stocks such as Forma Therapeutics Holdings, Turning Point Therapeutics, and Deciphera Pharmaceuticals. Currently, the analyst consensus on Seagen is a Moderate Buy with an average price target of $161.62, implying a 29.8% upside from current levels. In a report issued on February 10, J.P. |
SGEN Price Returns
1-mo | -0.88% |
3-mo | 18.60% |
6-mo | -22.32% |
1-year | -8.17% |
3-year | 112.50% |
5-year | 114.16% |
YTD | -7.74% |
2021 | -11.73% |
2020 | 53.28% |
2019 | 101.66% |
2018 | 5.91% |
2017 | 1.38% |
Continue Researching SGEN
Want to do more research on Seattle Genetics Inc's stock and its price? Try the links below:Seattle Genetics Inc (SGEN) Stock Price | Nasdaq
Seattle Genetics Inc (SGEN) Stock Quote, History and News - Yahoo Finance
Seattle Genetics Inc (SGEN) Stock Price and Basic Information | MarketWatch
Loading social stream, please wait...