
SigmaTron International, Inc. (SGMA): Price and Financial Metrics
SGMA Price/Volume Stats
| Current price | $4.82 | 52-week high | $7.89 |
| Prev. close | $4.88 | 52-week low | $2.61 |
| Day low | $4.73 | Volume | 33,224 |
| Day high | $5.04 | Avg. volume | 25,905 |
| 50-day MA | $5.14 | Dividend yield | N/A |
| 200-day MA | $3.87 | Market Cap | 29.37M |
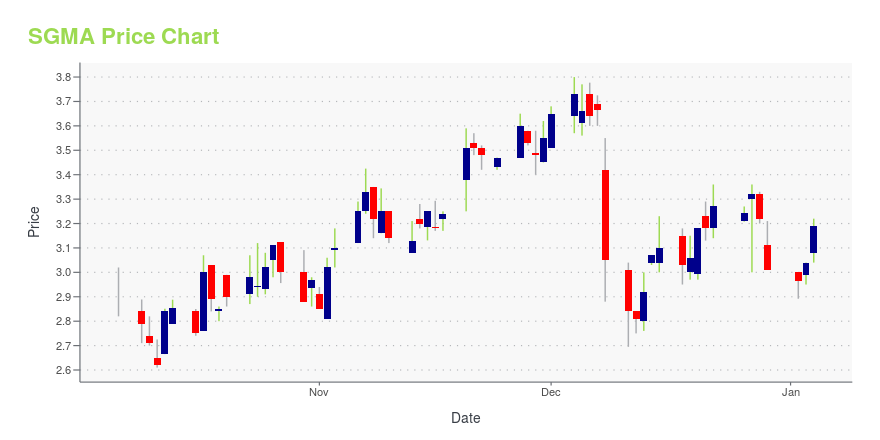
SGMA Stock Price Chart Interactive Chart >
SigmaTron International, Inc. (SGMA) Company Bio
SigmaTron International, Inc. contract manufactures electronic components, printed circuit board assemblies, and turnkey electronic products. The Company offers automatic and manual assembly and testing of products, material sourcing and procurement, engineering support, warehousing and shipment services, and product approval assistance.
Latest SGMA News From Around the Web
Below are the latest news stories about SIGMATRON INTERNATIONAL INC that investors may wish to consider to help them evaluate SGMA as an investment opportunity.
Most Shareholders Will Probably Agree With SigmaTron International, Inc.'s (NASDAQ:SGMA) CEO CompensationKey Insights SigmaTron International will host its Annual General Meeting on 22nd of September Total pay for CEO Gary... |
Today’s Biggest Pre-Market Stock Movers: 10 Top Gainers and Losers on TuesdayIt's time to start the day off with a breakdown of the biggest pre-market stock movers worth watching on Tuesday morning! |
Here's Why We Think SigmaTron International (NASDAQ:SGMA) Might Deserve Your Attention TodayInvestors are often guided by the idea of discovering 'the next big thing', even if that means buying 'story stocks... |
SigmaTron International, Inc. Reports Year End Financial Results For Fiscal 2023ELK GROVE VILLAGE, Ill., July 20, 2023 (GLOBE NEWSWIRE) -- SigmaTron International, Inc. (NASDAQ: SGMA), an electronic manufacturing services company (the “Company”), today reported revenues and earnings for the fiscal quarter and fiscal year ended April 30, 2023. As previously reported, the Company sold a majority position of its wholly owned subsidiary, Wagz, Inc. (“Wagz”), effective April 1, 2023. As a result, the Company will report results from Wagz for fiscal 2023 and 2022 as discontinued |
SigmaTron International, Inc. Regains Compliance with Nasdaq Listing Rule 5250(c)(1)ELK GROVE VILLAGE, Ill., May 22, 2023 (GLOBE NEWSWIRE) -- SigmaTron International, Inc. (NASDAQ: SGMA; the “Company”), announced today that on May 19, 2023, it received notice from the Listing Qualifications Department of the Nasdaq Stock Market LLC (“Nasdaq”) indicating the Company has regained compliance with Nasdaq Listing Rule 5250(c)(1) by filing with the Securities and Exchange Commission (“SEC”) its Form 10-Q for the quarterly period ended January 31, 2023 (“Form 10-Q”), on May 18, 2023. |
SGMA Price Returns
| 1-mo | -16.61% |
| 3-mo | 16.14% |
| 6-mo | 47.85% |
| 1-year | -20.59% |
| 3-year | -23.73% |
| 5-year | -2.63% |
| YTD | 60.13% |
| 2023 | -21.61% |
| 2022 | -62.83% |
| 2021 | 120.73% |
| 2020 | 16.13% |
| 2019 | 71.49% |
Continue Researching SGMA
Here are a few links from around the web to help you further your research on Sigmatron International Inc's stock as an investment opportunity:Sigmatron International Inc (SGMA) Stock Price | Nasdaq
Sigmatron International Inc (SGMA) Stock Quote, History and News - Yahoo Finance
Sigmatron International Inc (SGMA) Stock Price and Basic Information | MarketWatch
Loading social stream, please wait...