
Shake Shack, Inc. (SHAK): Price and Financial Metrics
SHAK Price/Volume Stats
| Current price | $80.11 | 52-week high | $111.29 |
| Prev. close | $78.84 | 52-week low | $52.79 |
| Day low | $78.57 | Volume | 826,609 |
| Day high | $80.62 | Avg. volume | 901,986 |
| 50-day MA | $90.10 | Dividend yield | N/A |
| 200-day MA | $83.05 | Market Cap | 3.39B |
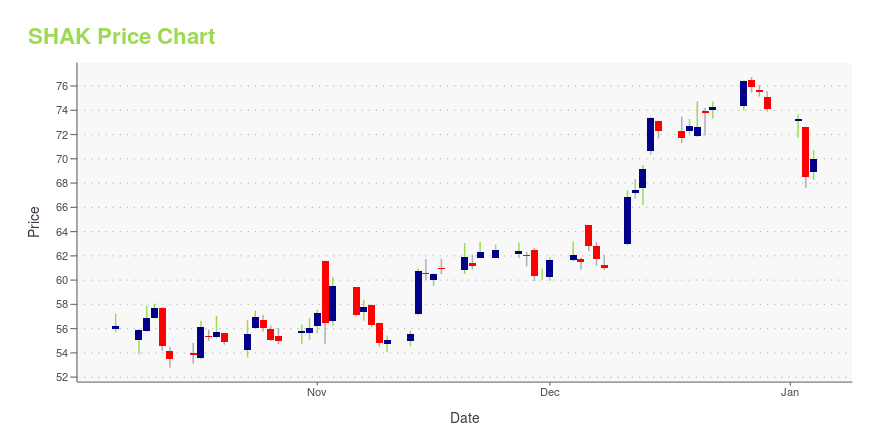
SHAK Stock Price Chart Interactive Chart >
Shake Shack, Inc. (SHAK) Company Bio
Shake Shack owns, operates, and licenses Shake Shack restaurants in the United States, the District of Columbia, North America, Europe, and Asia. The company offers hamburgers, hot dogs, crinkle-cut fries, shakes, frozen custard, beer, and wine. The company was founded in 2004 and is based in New York, New York.
Latest SHAK News From Around the Web
Below are the latest news stories about SHAKE SHACK INC that investors may wish to consider to help them evaluate SHAK as an investment opportunity.
Has Shake Shack (SHAK) Outpaced Other Retail-Wholesale Stocks This Year?Here is how Shake Shack (SHAK) and Carrols Restaurant Group (TAST) have performed compared to their sector so far this year. |
Restaurant Sales Soaring: 4 Stocks Poised for a 2024 RallyStocks like Wingstop Inc. (WING), Arcos Dorados Holdings Inc. (ARCO), Brinker International, Inc. (EAT) and Shake Shack Inc. (SHAK) are poised to benefit from the soaring restaurant sales. |
The Zacks Analyst Blog Highlights FAT Brands, Brinker International, Shake Shack, Carrols Restaurant Group and WingstopFAT Brands, Brinker International, Shake Shack, Carrols Restaurant Group and Wingstop are included in this Analyst Blog. |
Is Shake Shack (SHAK) a Good Investment Option?Wasatch Global Investors, an investment management firm, released its “Wasatch Small Cap Growth Strategy” third quarter 2023 investor letter. A copy of the same can be downloaded here. Stocks fell broadly in the quarter as investors worried about the consequences of rising interest rates and a possible recession. During the quarter, the strategy declined but […] |
5 Top Restaurant Stocks for Appetizing Returns in 2024Stocks such as FAT Brands (FAT), Brinker International (EAT), Shake Shack (SHAK), Carrols Restaurant (TAST) and Wingstop (WING) are well-poised to make the most of the positive trends in the restaurant industry. |
SHAK Price Returns
| 1-mo | -10.21% |
| 3-mo | -23.62% |
| 6-mo | 8.73% |
| 1-year | 4.76% |
| 3-year | -22.29% |
| 5-year | 8.05% |
| YTD | 8.08% |
| 2023 | 78.47% |
| 2022 | -42.45% |
| 2021 | -14.89% |
| 2020 | 42.32% |
| 2019 | 31.15% |
Continue Researching SHAK
Want to see what other sources are saying about Shake Shack Inc's financials and stock price? Try the links below:Shake Shack Inc (SHAK) Stock Price | Nasdaq
Shake Shack Inc (SHAK) Stock Quote, History and News - Yahoo Finance
Shake Shack Inc (SHAK) Stock Price and Basic Information | MarketWatch
Loading social stream, please wait...