
Shell PLC ADR (SHEL): Price and Financial Metrics
SHEL Price/Volume Stats
| Current price | $72.05 | 52-week high | $74.61 |
| Prev. close | $72.09 | 52-week low | $59.51 |
| Day low | $71.65 | Volume | 2,821,500 |
| Day high | $72.49 | Avg. volume | 4,197,070 |
| 50-day MA | $71.51 | Dividend yield | 3.86% |
| 200-day MA | $67.72 | Market Cap | 227.83B |
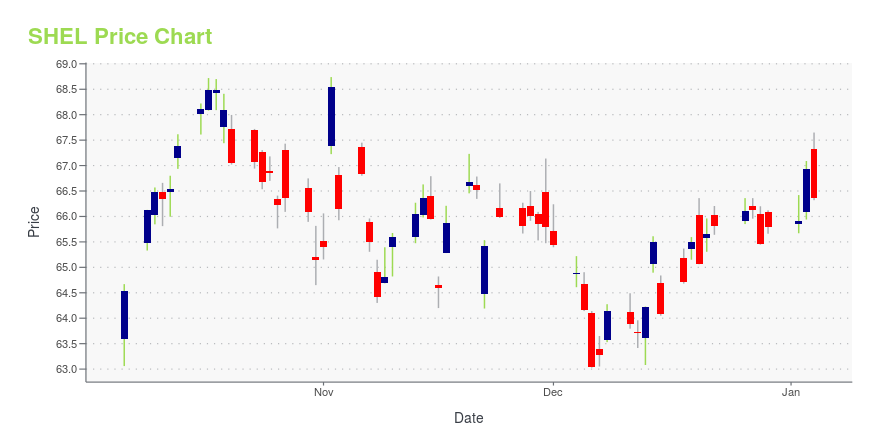
SHEL Stock Price Chart Interactive Chart >
Shell PLC ADR (SHEL) Company Bio
Shell Plc engages in oil and natural gas production. It operates through the following segments: Integrated Gas, Upstream, Oil Products, Chemicals and Corporate. The Integrated Gas segment manages liquefied natural gas activities and the conversion of natural gas into gas to liquids fuels and other products. The Upstream segment manages the exploration for and extraction of crude oil, natural gas, and natural gas liquids. The Oil Products segment manages the Refining and Trading, and Marketing classes of business. The Chemicals segment operates manufacturing plants and its own marketing network. The Corporate segment consists of holdings and treasury, self-insurance activities, and headquarters and central functions of the company. The company was founded in February 1907 and is headquartered in London, the United Kingdom.
Latest SHEL News From Around the Web
Below are the latest news stories about SHELL PLC that investors may wish to consider to help them evaluate SHEL as an investment opportunity.
10 Stocks to Sell Before the New YearI have a list of 10 stocks that my Portfolio Grader recently flagged as immediate sells. |
My Predictions for 2024I’ll share my predictions for 2024. |
Transaction in Own SharesTransaction in Own Shares December 28, 2023 • • • • • • • • • • • • • • • • Shell plc (the 'Company') announces that on 28 December 2023 it purchased the following number of Shares for cancellation. Aggregated information on Shares purchased according to trading venue: Date of PurchaseNumber of Shares purchasedHighest price paidLowest price paidVolume weighted average price paid per shareVenueCurrency28/12/20231,230,000£ 25.6550£ 25.3800£ 25.5187LSEGBP28/12/2023218,005£ 25.6500£ 25.4600£ 25.5328 |
Oil & Gas Stock Roundup: Exxon's Hebron Approval & Shell's Sparta FID Stand OutXOM, SHEL, EQNR, CVE and IMO emerge as the energy headline makers during the week. |
Shell (SHEL) Secures Natural Gas Production License in VenezuelaShell (SHEL) and Trinidad and Tobago's National Gas Company secure a 30-year license for the Dragon project, boosting economic prospects and LNG production. |
SHEL Price Returns
| 1-mo | 1.68% |
| 3-mo | -0.73% |
| 6-mo | 16.40% |
| 1-year | 23.47% |
| 3-year | 103.98% |
| 5-year | 27.14% |
| YTD | 11.75% |
| 2023 | 20.19% |
| 2022 | 36.02% |
| 2021 | 24.81% |
| 2020 | -40.42% |
| 2019 | 1.22% |
SHEL Dividends
| Ex-Dividend Date | Type | Payout Amount | Change | ||||||
|---|---|---|---|---|---|---|---|---|---|
| Loading, please wait... | |||||||||
Loading social stream, please wait...