Shopify Inc. Cl A (SHOP): Price and Financial Metrics
GET POWR RATINGS... FREE!
SHOP POWR Grades
- SHOP scores best on the Sentiment dimension, with a Sentiment rank ahead of 83.83% of US stocks.
- The strongest trend for SHOP is in Growth, which has been heading up over the past 177 days.
- SHOP's current lowest rank is in the Value metric (where it is better than 6.9% of US stocks).
SHOP Stock Summary
- SHOPIFY INC's market capitalization of $61,476,632,163 is ahead of 96.3% of US-listed equities.
- Over the past twelve months, SHOP has reported earnings growth of -193.17%, putting it ahead of only 8.16% of US stocks in our set.
- The volatility of SHOPIFY INC's share price is greater than that of 99.32% US stocks with at least 200 days of trading history.
- If you're looking for stocks that are quantitatively similar to SHOPIFY INC, a group of peers worth examining would be ATVI, PYPL, NTES, SQ, and ABNB.
- Visit SHOP's SEC page to see the company's official filings. To visit the company's web site, go to www.shopify.com.
SHOP Valuation Summary
- SHOP's price/earnings ratio is -16.1; this is 162.65% lower than that of the median Technology stock.
- SHOP's price/sales ratio has moved down 8.4 over the prior 93 months.
Below are key valuation metrics over time for SHOP.
Stock | Date | P/S | P/B | P/E | EV/EBIT |
---|---|---|---|---|---|
SHOP | 2023-01-20 | 9.8 | 5.9 | -16.1 | -14.7 |
SHOP | 2023-01-19 | 9.2 | 5.6 | -15.1 | -13.8 |
SHOP | 2023-01-18 | 9.5 | 5.7 | -15.5 | -14.2 |
SHOP | 2023-01-17 | 9.7 | 5.9 | -15.9 | -14.5 |
SHOP | 2023-01-13 | 9.4 | 5.7 | -15.4 | -14.1 |
SHOP | 2023-01-12 | 8.9 | 5.4 | -14.6 | -13.4 |
SHOP Growth Metrics
- Its 3 year net income to common stockholders growth rate is now at 349.73%.
- Its year over year net cashflow from operations growth rate is now at -51.18%.
- Its 5 year revenue growth rate is now at 289.13%.

The table below shows SHOP's growth in key financial areas (numbers in millions of US dollars).
Date | Revenue | Operating Cash Flow | Net Income to Common Stock |
---|---|---|---|
2022-09-30 | 5,244.91 | -131.375 | -3,208.035 |
2022-06-30 | 5,002.45 | 124.597 | -1,901.194 |
2022-03-31 | 4,826.832 | 315.185 | 181.806 |
2021-12-31 | 4,611.856 | 504.428 | 2,914.659 |
2021-12-31 | 4,611.856 | 504.428 | 2,914.659 |
2021-09-30 | 4,209.576 | 489.336 | 3,409.842 |
SHOP's Quality Factors
The “Quality” component of the POWR Ratings focuses on 31 different factors of a companies fundamentals and operational strength. Here are some key insights as we drill into the specifics of these quality attributes.- SHOP has a Quality Grade of C, ranking ahead of 56.26% of graded US stocks.
- SHOP's asset turnover comes in at 0.382 -- ranking 385th of 563 Business Services stocks.
- ALRM, ISSC, and TYL are the stocks whose asset turnover ratios are most correlated with SHOP.
The table below shows SHOP's key quality metrics over time.
Period | Asset Turnover | Gross Margin | ROIC |
---|---|---|---|
2021-09-30 | 0.382 | 0.545 | 0.437 |
2021-06-30 | 0.406 | 0.542 | 0.378 |
2021-03-31 | 0.443 | 0.535 | 0.331 |
2020-12-31 | 0.492 | 0.526 | 0.071 |
2020-12-31 | 0.492 | 0.526 | 0.071 |
2020-09-30 | 0.503 | 0.530 | 0.041 |
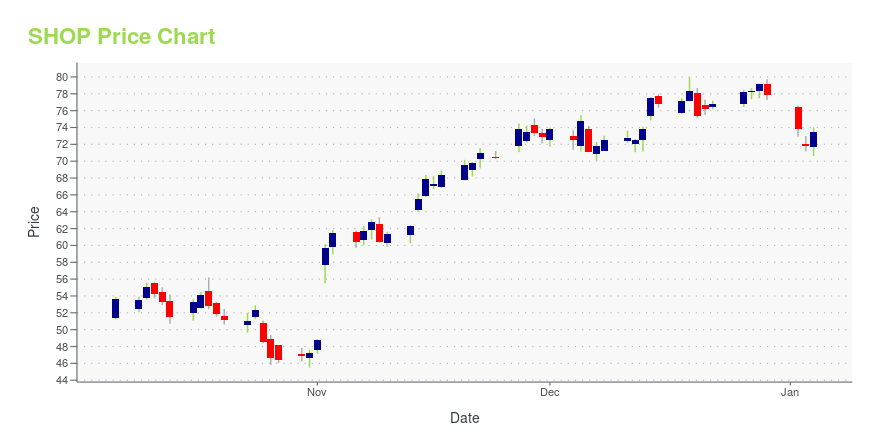
SHOP Stock Price Chart Interactive Chart >
SHOP Price/Volume Stats
Current price | $48.21 | 52-week high | $98.85 |
Prev. close | $50.08 | 52-week low | $23.63 |
Day low | $47.52 | Volume | 12,311,833 |
Day high | $49.65 | Avg. volume | 21,738,242 |
50-day MA | $38.49 | Dividend yield | N/A |
200-day MA | $36.11 | Market Cap | 60.88B |
Shopify Inc. Cl A (SHOP) Company Bio
Shopify Inc. allows Merchants to use its software to design, set up and manage their stores across multiple sales channels, including web, mobile, social media, brick-and-mortar locations, and pop-up shops. The company was founded in 2004 and is based in Ottawa, Canada.
Latest SHOP News From Around the Web
Below are the latest news stories about SHOPIFY INC that investors may wish to consider to help them evaluate SHOP as an investment opportunity.
Most Active Equity Options For Midday - Wed., Jan. 26Here are the most active equity options for midday. |
Why did Shopify stock surge on Wednesday? Newly pumped-up pricesShopify (NYSE:SHOP) stock drove to a double-digit gain on Wednesday after announcing major changes to pricing for sellers. The Canadian e-commerce company slated 33% increases to plans across the board. The platform will now charge $39 for the basic plan, up from $29, $105 for its Shopify plan, up from $79, and $399 for the top-end plan, up from $299. Price increases for existing customers are anticipated to take effect in April. Additionally, existing merchants may switch to an annual plan to lock in current pricing. The new pricing plans are in effect immediately ... |
Shopify stock surges 13% on pricing plan increases (update)Shopify (NYSE:SHOP) stock jumped about 13% on Wednesday after the announcement of increases to pricing plans. The Canadian e-commerce company announced in a blog post that prices for its basic, mid-range, and advanced services will be increased for the first time in over a decade. Prices for each plan are slated to increase about 33%. The company will now charge $39 for the basic plan, up from $29, $105 for its Shopify plan, up from $79, and $399 for the top-end plan, up from $299. “The price we charge for access to the best tools in commerce has remained largely unchanged for the last 1... |
Boeing, Microsoft Earnings Weigh On Wall StreetStocks are tumbling this afternoon, as corporate earnings spark fear over how Wall Street's heaviest hitters are faring amid rising rates and recession worries. |
These 2 Rising Stocks Have Investors Looking Forward to 2023Early in the day, big declines for the Dow Jones Industrial Average (DJINDICES: ^DJI), Nasdaq Composite (NASDAQINDEX: ^IXIC), and S&P 500 (SNPINDEX: ^GSPC) made it look as though markets were ready to give back a sizable portion of their gains from earlier in the month. Fourth-quarter results from the company made shareholders optimistic about the coming year for the bank stock. |
SHOP Price Returns
1-mo | 38.89% |
3-mo | 38.57% |
6-mo | 14.98% |
1-year | -44.73% |
3-year | 3.53% |
5-year | 276.88% |
YTD | 38.89% |
2022 | -74.80% |
2021 | 21.68% |
2020 | 184.71% |
2019 | 187.17% |
2018 | 37.08% |
Continue Researching SHOP
Here are a few links from around the web to help you further your research on Shopify Inc's stock as an investment opportunity:Shopify Inc (SHOP) Stock Price | Nasdaq
Shopify Inc (SHOP) Stock Quote, History and News - Yahoo Finance
Shopify Inc (SHOP) Stock Price and Basic Information | MarketWatch
Loading social stream, please wait...