Sientra, Inc. (SIEN): Price and Financial Metrics
SIEN Price/Volume Stats
Current price | $0.85 | 52-week high | $4.94 |
Prev. close | $0.86 | 52-week low | $0.59 |
Day low | $0.82 | Volume | 17,501 |
Day high | $0.85 | Avg. volume | 447,619 |
50-day MA | $1.45 | Dividend yield | N/A |
200-day MA | $2.04 | Market Cap | 10.16M |
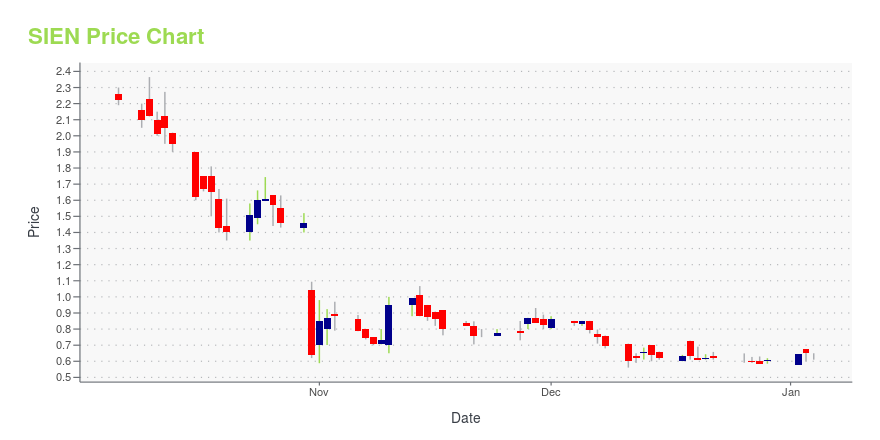
SIEN Stock Price Chart Interactive Chart >
SIEN POWR Grades
- SIEN scores best on the Growth dimension, with a Growth rank ahead of 88.86% of US stocks.
- The strongest trend for SIEN is in Quality, which has been heading up over the past 177 days.
- SIEN's current lowest rank is in the Sentiment metric (where it is better than 1.79% of US stocks).
SIEN Stock Summary
- SIENTRA INC's capital turnover -- a measure of revenue relative to shareholder's equity -- is better than merely 2.87% of US listed stocks.
- With a price/sales ratio of 0.11, SIENTRA INC has a higher such ratio than just 3.53% of stocks in our set.
- Equity multiplier, or assets relative to shareholders' equity, comes in at -18.62 for SIENTRA INC; that's greater than it is for just 1.24% of US stocks.
- If you're looking for stocks that are quantitatively similar to SIENTRA INC, a group of peers worth examining would be CUTR, ATEC, PTON, OGN, and LVO.
- SIEN's SEC filings can be seen here. And to visit SIENTRA INC's official web site, go to sientra.com.
SIEN Valuation Summary
- In comparison to the median Healthcare stock, SIEN's EV/EBIT ratio is 111.17% lower, now standing at -1.1.
- SIEN's price/earnings ratio has moved up 23.1 over the prior 110 months.
Below are key valuation metrics over time for SIEN.
Stock | Date | P/S | P/B | P/E | EV/EBIT |
---|---|---|---|---|---|
SIEN | 2023-11-03 | 0.1 | -0.5 | -0.2 | -1.1 |
SIEN | 2023-11-02 | 0.1 | -0.5 | -0.2 | -1.1 |
SIEN | 2023-11-01 | 0.1 | -0.5 | -0.2 | -1.1 |
SIEN | 2023-10-31 | 0.1 | -0.4 | -0.1 | -1.0 |
SIEN | 2023-10-30 | 0.2 | -0.9 | -0.3 | -1.2 |
SIEN | 2023-10-27 | 0.2 | -0.9 | -0.3 | -1.2 |
SIEN Growth Metrics
- Its 4 year revenue growth rate is now at 210.55%.
- Its year over year price growth rate is now at -80.86%.
- The 3 year cash and equivalents growth rate now stands at -37.24%.

The table below shows SIEN's growth in key financial areas (numbers in millions of US dollars).
Date | Revenue | Operating Cash Flow | Net Income to Common Stock |
---|---|---|---|
2022-09-30 | 88.129 | -46.606 | -67.394 |
2022-06-30 | 85.179 | -58.357 | -24.003 |
2022-03-31 | 83.769 | -47.748 | -25.833 |
2021-12-31 | 80.683 | -42.5 | -62.482 |
2021-09-30 | 85.603 | -36.94 | -67.651 |
2021-06-30 | 85.2 | -28.63 | -101.882 |
SIEN's Quality Factors
The “Quality” component of the POWR Ratings focuses on 31 different factors of a companies fundamentals and operational strength. Here are some key insights as we drill into the specifics of these quality attributes.- SIEN has a Quality Grade of C, ranking ahead of 28.53% of graded US stocks.
- SIEN's asset turnover comes in at 0.463 -- ranking 103rd of 186 Medical Equipment stocks.
- NAOV, NUWE, and ISR are the stocks whose asset turnover ratios are most correlated with SIEN.
The table below shows SIEN's key quality metrics over time.
Period | Asset Turnover | Gross Margin | ROIC |
---|---|---|---|
2021-06-30 | 0.463 | 0.534 | -1.000 |
2021-03-31 | 0.425 | 0.530 | -1.073 |
2020-12-31 | 0.378 | 0.547 | -0.825 |
2020-09-30 | 0.363 | 0.586 | -0.881 |
2020-06-30 | 0.360 | 0.586 | -1.192 |
2020-03-31 | 0.372 | 0.599 | -1.612 |
SIEN Price Target
For more insight on analysts targets of SIEN, see our SIEN price target page. And for a list of of all stocks sorted by upside potential based on analyst target price, see our Top Price Target page.
Average Price Target | $11.29 | Average Broker Recommendation | 1.12 (Strong Buy) |
Sientra, Inc. (SIEN) Company Bio
Sientra Inc. develops and sells medical aesthetics products to plastic surgeons in the United States. The company was founded in 2003 and is based in Santa Barbara, California.
Latest SIEN News From Around the Web
Below are the latest news stories about SIENTRA INC that investors may wish to consider to help them evaluate SIEN as an investment opportunity.
Sientra, Inc. (NASDAQ:SIEN) Q3 2023 Earnings Call TranscriptSientra, Inc. (NASDAQ:SIEN) Q3 2023 Earnings Call Transcript November 9, 2023 Sientra, Inc. misses on earnings expectations. Reported EPS is $-1.31 EPS, expectations were $-0.48. Operator: Good afternoon and welcome to the Sientra Third Quarter 2023 Financial Results Conference Call. My name is Dave. At this time, all participants are in a listen-only mode. After […] |
Q3 2023 Sientra Inc Earnings CallQ3 2023 Sientra Inc Earnings Call |
Sientra Reports Third Quarter Financial and Operational ResultsIRVINE, Calif., Nov. 09, 2023 (GLOBE NEWSWIRE) -- Sientra, Inc. (NASDAQ: SIEN) (“Sientra” or the “Company”), a surgical aesthetics company developing the safest and most innovative solutions for the best aesthetic outcomes, today announced its financial results for the third quarter that ended September 30, 2023. Third Quarter 2023 Financial and Business Highlights Net sales of $19.5 million representing a decrease of 13.7% over the third quarter of 2022. For the first nine months of 2023, net s |
Sientra to Present at the Stifel 2023 Healthcare ConferenceIRVINE, Calif., Nov. 08, 2023 (GLOBE NEWSWIRE) -- Sientra, Inc. (NASDAQ: SIEN) (“Sientra” or the “Company”), a surgical aesthetics company developing the safest and most innovative solutions for the best aesthetic outcomes, today announced its participation at the Stifel 2023 Healthcare Conference. As part of the conference, the company’s management team will participate in a live fireside chat on Wednesday, November 15, 2023 at 8:00am EST / 5:00am PST. An on-demand webcast of the presentation w |
Today’s Biggest Pre-Market Stock Movers: 10 Top Gainers and Losers on WednesdayWe're starting off Wednesday with a breakdown of the biggest pre-market stock movers investors will want to keep track of today! |
SIEN Price Returns
1-mo | -3.52% |
3-mo | -63.04% |
6-mo | -49.70% |
1-year | -70.22% |
3-year | -98.47% |
5-year | N/A |
YTD | -58.11% |
2022 | -94.47% |
2021 | -5.66% |
2020 | -56.49% |
2019 | -29.66% |
2018 | -9.60% |
Continue Researching SIEN
Here are a few links from around the web to help you further your research on Sientra Inc's stock as an investment opportunity:Sientra Inc (SIEN) Stock Price | Nasdaq
Sientra Inc (SIEN) Stock Quote, History and News - Yahoo Finance
Sientra Inc (SIEN) Stock Price and Basic Information | MarketWatch
Loading social stream, please wait...