Signet Jewelers Limited (SIG): Price and Financial Metrics
GET POWR RATINGS... FREE!
SIG POWR Grades
- Value is the dimension where SIG ranks best; there it ranks ahead of 88.3% of US stocks.
- SIG's strongest trending metric is Quality; it's been moving down over the last 177 days.
- SIG's current lowest rank is in the Stability metric (where it is better than 11.53% of US stocks).
SIG Stock Summary
- The capital turnover (annual revenue relative to shareholder's equity) for SIG is 5.88 -- better than 92.88% of US stocks.
- SIG's price/sales ratio is 0.45; that's higher than the P/S ratio of just 12.95% of US stocks.
- SIGNET JEWELERS LTD's shareholder yield -- a measure of how much capital is returned to stockholders via dividends and buybacks -- is 17.3%, greater than the shareholder yield of 91.3% of stocks in our set.
- Stocks with similar financial metrics, market capitalization, and price volatility to SIGNET JEWELERS LTD are HIBB, DXLG, GMS, TBI, and BNED.
- Visit SIG's SEC page to see the company's official filings. To visit the company's web site, go to www.signetjewelers.com.
SIG Valuation Summary
- In comparison to the median Consumer Cyclical stock, SIG's EV/EBIT ratio is 32.62% lower, now standing at 9.5.
- SIG's price/sales ratio has moved up 0.3 over the prior 243 months.
Below are key valuation metrics over time for SIG.
Stock | Date | P/S | P/B | P/E | EV/EBIT |
---|---|---|---|---|---|
SIG | 2023-02-02 | 0.5 | 2.7 | 9.8 | 9.5 |
SIG | 2023-02-01 | 0.5 | 2.7 | 9.5 | 9.3 |
SIG | 2023-01-31 | 0.4 | 2.6 | 9.2 | 9.0 |
SIG | 2023-01-30 | 0.4 | 2.5 | 9.1 | 9.0 |
SIG | 2023-01-27 | 0.4 | 2.5 | 9.1 | 9.0 |
SIG | 2023-01-26 | 0.4 | 2.5 | 9.1 | 8.9 |
SIG Growth Metrics
- The 2 year net cashflow from operations growth rate now stands at 117.01%.
- Its year over year revenue growth rate is now at 31.53%.
- Its 3 year revenue growth rate is now at 28.67%.

The table below shows SIG's growth in key financial areas (numbers in millions of US dollars).
Date | Revenue | Operating Cash Flow | Net Income to Common Stock |
---|---|---|---|
2022-09-30 | 7,987.2 | 617.9 | 379.2 |
2022-06-30 | 7,942.3 | 683.9 | 434.3 |
2022-03-31 | 7,975.5 | 960.7 | 513.5 |
2021-12-31 | 7,826 | 1,257.3 | 735.4 |
2021-09-30 | 7,201.2 | 1,249.5 | 675.4 |
2021-06-30 | 6,963.7 | 1,674.7 | 592.4 |
SIG's Quality Factors
The “Quality” component of the POWR Ratings focuses on 31 different factors of a companies fundamentals and operational strength. Here are some key insights as we drill into the specifics of these quality attributes.- SIG has a Quality Grade of A, ranking ahead of 95.74% of graded US stocks.
- SIG's asset turnover comes in at 1.105 -- ranking 129th of 165 Retail stocks.
- SPH, TCS, and HBI are the stocks whose asset turnover ratios are most correlated with SIG.
The table below shows SIG's key quality metrics over time.
Period | Asset Turnover | Gross Margin | ROIC |
---|---|---|---|
2021-07-31 | 1.105 | 0.388 | 0.161 |
2021-05-01 | 0.952 | 0.364 | 0.080 |
2021-01-30 | 0.799 | 0.331 | -0.010 |
2020-10-31 | 0.790 | 0.339 | -0.020 |
2020-08-01 | 0.786 | 0.333 | -0.031 |
2020-05-02 | 0.881 | 0.347 | -0.020 |
SIG Price Target
For more insight on analysts targets of SIG, see our SIG price target page. And for a list of of all stocks sorted by upside potential based on analyst target price, see our Top Price Target page.
Average Price Target | $90.00 | Average Broker Recommendation | 1.7 (Moderate Buy) |
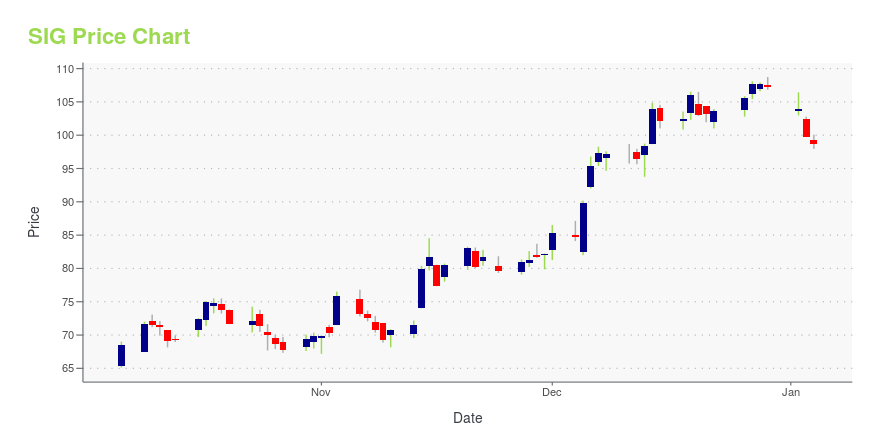
SIG Stock Price Chart Interactive Chart >
SIG Price/Volume Stats
Current price | $78.33 | 52-week high | $88.18 |
Prev. close | $78.76 | 52-week low | $48.31 |
Day low | $77.05 | Volume | 169,880 |
Day high | $79.77 | Avg. volume | 552,274 |
50-day MA | $70.59 | Dividend yield | 1.02% |
200-day MA | $63.68 | Market Cap | 3.56B |
Signet Jewelers Limited (SIG) Company Bio
Signet Jewelers is the world's largest retailer of diamond jewelry. Signet operates approximately 3,600 stores primarily under the name brands of Kay Jewelers, Zales, Jared The Galleria Of Jewelry, H.Samuel, Ernest Jones, Peoples and Piercing Pagoda. The company was founded in 1950 and is based in Hamilton, Bermuda.
Latest SIG News From Around the Web
Below are the latest news stories about SIGNET JEWELERS LTD that investors may wish to consider to help them evaluate SIG as an investment opportunity.
5 Promising Price-to-Book Value Stocks to Buy in FebruaryThe P/B ratio helps to identify low-priced stocks that have high growth prospects. Deutsche Bank Aktiengesellschaft (DB), Signet Jewelers (SIG), Phillips 66 (PSX), Acco Brands Corporation (ACCO) and Sterling Infrastructure (STRL) are some such stocks. |
Add Value to Your Investment With These 4 Low P/CF StocksValue investing is essentially about selecting stocks that are usually cheap but fundamentally sound. Signet (SIG), NRG Energy (NRG), ACCO Brands (ACCO) and Sterling Infrastructure (STRL) boast low P/CF ratios. |
Insiders Selling Signet Jewelers, BJ''s Wholesale Club And 2 Other StocksThe Nasdaq settled higher by 2% on Thursday. Investors, meanwhile, focused on some notable insider trades. When insiders sell shares, it indicates their concern in the company’s prospects or that they view the stock as being overpriced. Either way, this signals an opportunity to go short on the stock. Insider sales should not be taken as the only indicator for making an investment or trading decision. At best, it can lend conviction to a selling decision. Below is a look at a few recent notable insider sales. For more, check out Benzinga''s insider transactions platform. BJ''s Wholesale Club The Trade: BJ''s Wholesale Club Holdings, Inc. (NYSE: BJ ) President and CEO Robert Eddy sold a total of 5,400 shares at an average price of $70.08. The insider received around $98.11 thousand from ... |
Signet Jewelers Limited's (NYSE:SIG) Intrinsic Value Is Potentially 45% Above Its Share PriceHow far off is Signet Jewelers Limited ( NYSE:SIG ) from its intrinsic value? Using the most recent financial data... |
Here's What Makes Signet (SIG) Stock Appear Promising NowSignet (SIG) continues to benefit from its solid digital efforts. SIG's Inspiring Brilliance growth strategy appears promising as well. |
SIG Price Returns
1-mo | 9.85% |
3-mo | 32.01% |
6-mo | 19.54% |
1-year | -3.71% |
3-year | 216.93% |
5-year | 80.72% |
YTD | 15.49% |
2022 | -20.96% |
2021 | 220.69% |
2020 | 27.22% |
2019 | -26.28% |
2018 | -42.19% |
SIG Dividends
Ex-Dividend Date | Type | Payout Amount | Change | ||||||
---|---|---|---|---|---|---|---|---|---|
Loading, please wait... |
Continue Researching SIG
Want to see what other sources are saying about Signet Jewelers Ltd's financials and stock price? Try the links below:Signet Jewelers Ltd (SIG) Stock Price | Nasdaq
Signet Jewelers Ltd (SIG) Stock Quote, History and News - Yahoo Finance
Signet Jewelers Ltd (SIG) Stock Price and Basic Information | MarketWatch
Loading social stream, please wait...