Selective Insurance Group, Inc. (SIGI): Price and Financial Metrics
GET POWR RATINGS... FREE!
SIGI POWR Grades
- SIGI scores best on the Stability dimension, with a Stability rank ahead of 92.35% of US stocks.
- The strongest trend for SIGI is in Growth, which has been heading down over the past 177 days.
- SIGI ranks lowest in Growth; there it ranks in the 24th percentile.
SIGI Stock Summary
- SIGI's went public 32.86 years ago, making it older than 85.87% of listed US stocks we're tracking.
- Of note is the ratio of SELECTIVE INSURANCE GROUP INC's sales and general administrative expense to its total operating expenses; 86.97% of US stocks have a lower such ratio.
- The volatility of SELECTIVE INSURANCE GROUP INC's share price is greater than that of just 17.49% US stocks with at least 200 days of trading history.
- Stocks with similar financial metrics, market capitalization, and price volatility to SELECTIVE INSURANCE GROUP INC are AIT, COLM, MSM, SITE, and JBT.
- SIGI's SEC filings can be seen here. And to visit SELECTIVE INSURANCE GROUP INC's official web site, go to www.selective.com.
SIGI Valuation Summary
- SIGI's price/earnings ratio is 24.3; this is 113.16% higher than that of the median Financial Services stock.
- SIGI's EV/EBIT ratio has moved up 2.2 over the prior 243 months.
Below are key valuation metrics over time for SIGI.
Stock | Date | P/S | P/B | P/E | EV/EBIT |
---|---|---|---|---|---|
SIGI | 2023-01-23 | 1.6 | 2.3 | 24.3 | 18.5 |
SIGI | 2023-01-20 | 1.6 | 2.2 | 23.8 | 18.2 |
SIGI | 2023-01-19 | 1.6 | 2.2 | 23.7 | 18.2 |
SIGI | 2023-01-18 | 1.6 | 2.3 | 24.2 | 18.5 |
SIGI | 2023-01-17 | 1.6 | 2.3 | 24.4 | 18.7 |
SIGI | 2023-01-13 | 1.7 | 2.4 | 25.2 | 19.2 |
SIGI Growth Metrics
- Its 2 year price growth rate is now at 77.09%.
- Its 3 year net cashflow from operations growth rate is now at 44.09%.
- Its 4 year cash and equivalents growth rate is now at 2924.02%.

The table below shows SIGI's growth in key financial areas (numbers in millions of US dollars).
Date | Revenue | Operating Cash Flow | Net Income to Common Stock |
---|---|---|---|
2022-09-30 | 3,475.595 | 713.563 | 228.154 |
2022-06-30 | 3,445.619 | 722.453 | 259.334 |
2022-03-31 | 3,421.319 | 733.845 | 341.697 |
2021-12-31 | 3,379.164 | 771.422 | 394.484 |
2021-09-30 | 3,307.901 | 716.465 | 424.866 |
2021-06-30 | 3,219.423 | 649.112 | 423.336 |
SIGI's Quality Factors
The “Quality” component of the POWR Ratings focuses on 31 different factors of a companies fundamentals and operational strength. Here are some key insights as we drill into the specifics of these quality attributes.- SIGI has a Quality Grade of C, ranking ahead of 60.02% of graded US stocks.
- SIGI's asset turnover comes in at 0.33 -- ranking 50th of 133 Insurance stocks.
- L, PRU, and AAME are the stocks whose asset turnover ratios are most correlated with SIGI.
The table below shows SIGI's key quality metrics over time.
Period | Asset Turnover | Gross Margin | ROIC |
---|---|---|---|
2021-09-30 | 0.330 | 0.479 | 0.054 |
2021-06-30 | 0.328 | 0.482 | 0.054 |
2021-03-31 | 0.319 | 0.461 | 0.044 |
2020-12-31 | 0.312 | 0.440 | 0.033 |
2020-09-30 | 0.312 | 0.426 | 0.028 |
2020-06-30 | 0.311 | 0.430 | 0.027 |
SIGI Price Target
For more insight on analysts targets of SIGI, see our SIGI price target page. And for a list of of all stocks sorted by upside potential based on analyst target price, see our Top Price Target page.
Average Price Target | $85.80 | Average Broker Recommendation | 1.88 (Hold) |
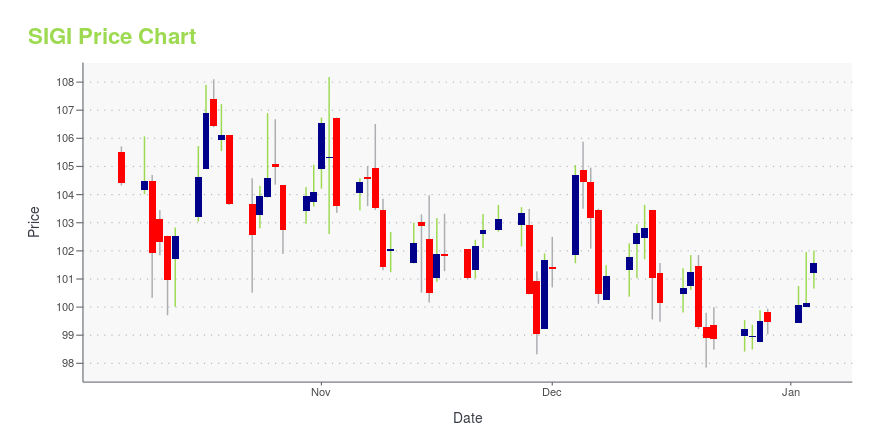
SIGI Stock Price Chart Interactive Chart >
SIGI Price/Volume Stats
Current price | $93.60 | 52-week high | $98.80 |
Prev. close | $92.79 | 52-week low | $66.81 |
Day low | $92.18 | Volume | 171,600 |
Day high | $94.03 | Avg. volume | 210,389 |
50-day MA | $91.65 | Dividend yield | 1.28% |
200-day MA | $85.23 | Market Cap | 5.64B |
Selective Insurance Group, Inc. (SIGI) Company Bio
Selective Insurance Group provides insurance products and services in the United States. It operates in four segments: Standard Commercial Lines, Standard Personal Lines, excess and surplus (E&S) Lines, and Investments. The company was founded in 1925 and is based in Branchville, New Jersey.
Latest SIGI News From Around the Web
Below are the latest news stories about SELECTIVE INSURANCE GROUP INC that investors may wish to consider to help them evaluate SIGI as an investment opportunity.
Selective Insurance Group, Inc. Announces Preliminary Fourth Quarter 2022 Results, Including Catastrophe Loss EstimatesSelective Insurance Group, Inc. (Nasdaq: SIGI) today announced preliminary fourth quarter 2022 results and pre-tax net catastrophe loss estimates. |
Reasons Why You Should Retain Selective Insurance (SIGI) StockSelective Insurance (SIGI) is well-poised to gain from renewal pure price increases, higher direct new business, higher returns on alternative investments and solid capital position. |
Selective Insurance Group, Inc. Schedules Earnings Release and Conference Call to Announce Fourth Quarter 2022 ResultsSelective Insurance Group, Inc. (Nasdaq: SIGI) announced its fourth quarter 2022 financial results will be released on Thursday, February 2, 2023 after market close. A press release and financial supplement will also be available on the Investors page of Selective's website at that time. |
Selective Insurance Group's (NASDAQ:SIGI) investors will be pleased with their notable 62% return over the last five yearsStock pickers are generally looking for stocks that will outperform the broader market. And the truth is, you can make... |
MOST U.S. RESIDENTS DECK THE HALLS WITH FIRE HAZARDS, SELECTIVE INSURANCE STUDY REVEALSMake sure it's only the yule log burning before you decorate this holiday season, urges Selective Insurance, a leading business, home, auto, and flood insurance company. A recent survey commissioned by Selective Insurance and conducted online by The Harris Poll among more than 2,000 U.S. adults found that 97% of those who decorate inside their homes for the holidays do so with at least one fire hazard. |
SIGI Price Returns
1-mo | 5.63% |
3-mo | -1.48% |
6-mo | 24.49% |
1-year | 20.31% |
3-year | 47.71% |
5-year | 72.12% |
YTD | 5.63% |
2022 | 9.67% |
2021 | 24.02% |
2020 | 4.48% |
2019 | 8.24% |
2018 | 5.11% |
SIGI Dividends
Ex-Dividend Date | Type | Payout Amount | Change | ||||||
---|---|---|---|---|---|---|---|---|---|
Loading, please wait... |
Continue Researching SIGI
Here are a few links from around the web to help you further your research on Selective Insurance Group Inc's stock as an investment opportunity:Selective Insurance Group Inc (SIGI) Stock Price | Nasdaq
Selective Insurance Group Inc (SIGI) Stock Quote, History and News - Yahoo Finance
Selective Insurance Group Inc (SIGI) Stock Price and Basic Information | MarketWatch
Loading social stream, please wait...