Sino-Global Shipping America, Ltd. (SINO): Price and Financial Metrics
GET POWR RATINGS... FREE!
SINO POWR Grades
- Momentum is the dimension where SINO ranks best; there it ranks ahead of 78.44% of US stocks.
- The strongest trend for SINO is in Stability, which has been heading down over the past 148 days.
- SINO's current lowest rank is in the Value metric (where it is better than 0.15% of US stocks).
SINO Stock Summary
- Equity multiplier, or assets relative to shareholders' equity, comes in at 0.98 for Sino-Global Shipping America Ltd; that's greater than it is for merely 5.06% of US stocks.
- With a year-over-year growth in debt of 209.68%, Sino-Global Shipping America Ltd's debt growth rate surpasses 95.08% of about US stocks.
- Sino-Global Shipping America Ltd's shareholder yield -- a measure of how much capital is returned to stockholders via dividends and buybacks -- is -76.33%, greater than the shareholder yield of merely 4.65% of stocks in our set.
- Stocks that are quantitatively similar to SINO, based on their financial statements, market capitalization, and price volatility, are VERI, EMX, BSGM, DRIO, and AXDX.
- Visit SINO's SEC page to see the company's official filings. To visit the company's web site, go to www.sino-global.com.
SINO Valuation Summary
- In comparison to the median Industrials stock, SINO's price/sales ratio is 405.56% higher, now standing at 9.1.
- Over the past 162 months, SINO's price/sales ratio has gone up 7.3.
- SINO's price/sales ratio has moved up 7.3 over the prior 162 months.
Below are key valuation metrics over time for SINO.
Stock | Date | P/S | P/B | P/E | EV/EBIT |
---|---|---|---|---|---|
SINO | 2021-09-03 | 9.1 | 0.9 | -3.1 | -0.1 |
SINO | 2021-09-02 | 9.1 | 0.9 | -3.1 | -0.1 |
SINO | 2021-09-01 | 8.6 | 0.8 | -2.9 | 0.1 |
SINO | 2021-08-31 | 8.7 | 0.8 | -2.9 | 0.1 |
SINO | 2021-08-30 | 8.6 | 0.8 | -2.9 | 0.1 |
SINO | 2021-08-27 | 8.3 | 0.8 | -2.8 | 0.2 |
SINO Growth Metrics
- Its 5 year cash and equivalents growth rate is now at -96.49%.
- Its 2 year revenue growth rate is now at -65.02%.
- The 4 year price growth rate now stands at -25.64%.

The table below shows SINO's growth in key financial areas (numbers in millions of US dollars).
Date | Revenue | Operating Cash Flow | Net Income to Common Stock |
---|---|---|---|
2021-09-30 | 5.810443 | -3.481394 | -8.944564 |
2021-06-30 | 5.151032 | -4.150112 | -6.823343 |
2021-03-31 | 5.34906 | -6.410492 | -15.91808 |
2020-12-31 | 5.749845 | -3.788876 | -16.25492 |
2020-09-30 | 5.886529 | -1.623653 | -15.55933 |
2020-09-30 | 5.886529 | -1.623653 | -15.55933 |
SINO's Quality Factors
The “Quality” component of the POWR Ratings focuses on 31 different factors of a companies fundamentals and operational strength. Here are some key insights as we drill into the specifics of these quality attributes.- SINO has a Quality Grade of D, ranking ahead of 6.07% of graded US stocks.
- SINO's asset turnover comes in at 0.159 -- ranking 115th of 137 Transportation stocks.
- WERN, OSG, and FDX are the stocks whose asset turnover ratios are most correlated with SINO.
The table below shows SINO's key quality metrics over time.
Period | Asset Turnover | Gross Margin | ROIC |
---|---|---|---|
2021-06-30 | 0.159 | 0.034 | -2.530 |
2021-03-31 | 0.260 | 0.022 | -8.002 |
2020-12-31 | 0.515 | 0.126 | -3.669 |
2020-09-30 | 0.438 | 0.305 | -1.956 |
2020-09-30 | 0.438 | 0.305 | -1.956 |
2020-09-30 | 0.438 | 0.305 | -1.371 |
SINO Stock Price Chart Interactive Chart >
SINO Price/Volume Stats
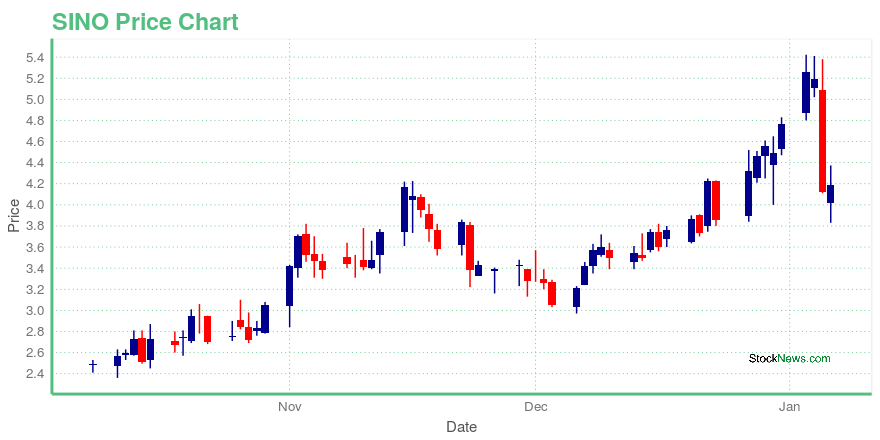
Current price | $4.19 | 52-week high | $12.28 |
Prev. close | $4.12 | 52-week low | $2.09 |
Day low | $3.83 | Volume | 2,418,100 |
Day high | $4.37 | Avg. volume | 2,405,025 |
50-day MA | $3.72 | Dividend yield | N/A |
200-day MA | $3.53 | Market Cap | 67.68M |
Sino-Global Shipping America, Ltd. (SINO) Company Bio
Sino-Global Shipping America Ltd. offers marine shipping agency services. The Company handles handysize, panamax, capesize, roll-on and roll-off, and very large crude carrier class ships.
Latest SINO News From Around the Web
Below are the latest news stories about Sino-Global Shipping America Ltd that investors may wish to consider to help them evaluate SINO as an investment opportunity.
Today’s Biggest Pre-Market Stock Movers: 10 Top Gainers and Losers on ThursdayGood morning, trader! |
Singularity Future Technology Enters Into Warrant Purchase AgreementOn January 6, 2022, Singularity Future Technology Ltd. (formerly knowns as Sino-Global Shipping America, Ltd.) (the "Company") entered into a Warrant Purchase Agreement with certain accredited investors (the "Sellers") pursuant to which the Company agreed to buy back an aggregate of 3,870,800 warrants (the "Warrants") from the Sellers, and the Sellers agreed to sell the Warrants back to the Company. These Warrants were sold to these Sellers in three previous transactions that closed on February |
Sino-Global Changes Name to Singularity Future Technology Ltd.; Reflects New Focus and MandateSino-Global Shipping America, Ltd. (NASDAQ: SINO) the "Company") today announced it is changing its name to Singularity Future Technology Ltd. to reflect its new focus and mandate. The Company's shares are expected to begin trading on NASDAQ under the new ticker symbol "SGLY" beginning January 7, 2022. |
Sino-Global Shipping America (NASDAQ:SINO) swells 20% this week, taking one-year gains to 123%When you buy shares in a company, there is always a risk that the price drops to zero. But if you pick the right... |
Sino-Global Shipping America (NASDAQ:SINO) Share Price Crosses Above 200-Day Moving Average of $3.07Sino-Global Shipping America, Ltd. (NASDAQ:SINO)s share price crossed above its 200-day moving average during trading on Tuesday . The stock has a 200-day moving average of $3.07 and traded as high as $3.46. Sino-Global Shipping America shares last traded at $3.42, with a volume of 250,367 shares trading hands. The business has a fifty day [] |
SINO Price Returns
1-mo | N/A |
3-mo | N/A |
6-mo | -12.16% |
1-year | 26.97% |
3-year | 16.39% |
5-year | -70.90% |
YTD | -12.16% |
2021 | 131.55% |
2020 | -8.44% |
2019 | -41.33% |
2018 | -70.04% |
2017 | -17.42% |
Continue Researching SINO
Want to see what other sources are saying about Sino-Global Shipping America Ltd's financials and stock price? Try the links below:Sino-Global Shipping America Ltd (SINO) Stock Price | Nasdaq
Sino-Global Shipping America Ltd (SINO) Stock Quote, History and News - Yahoo Finance
Sino-Global Shipping America Ltd (SINO) Stock Price and Basic Information | MarketWatch
Loading social stream, please wait...