Sitime Corporation (SITM): Price and Financial Metrics
SITM Price/Volume Stats
Current price | $106.88 | 52-week high | $142.88 |
Prev. close | $106.55 | 52-week low | $73.10 |
Day low | $105.80 | Volume | 130,700 |
Day high | $109.55 | Avg. volume | 272,853 |
50-day MA | $125.02 | Dividend yield | N/A |
200-day MA | $117.19 | Market Cap | 2.37B |
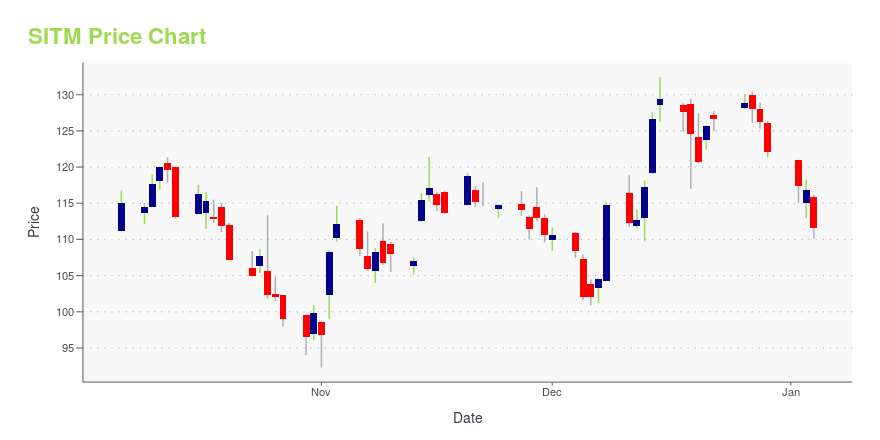
SITM Stock Price Chart Interactive Chart >
SITM POWR Grades
- Momentum is the dimension where SITM ranks best; there it ranks ahead of 76.92% of US stocks.
- The strongest trend for SITM is in Quality, which has been heading down over the past 179 days.
- SITM's current lowest rank is in the Growth metric (where it is better than 3.19% of US stocks).
SITM Stock Summary
- Price to trailing twelve month operating cash flow for SITM is currently 359.13, higher than 99.27% of US stocks with positive operating cash flow.
- With a price/sales ratio of 12.73, SITIME CORP has a higher such ratio than 92.09% of stocks in our set.
- Equity multiplier, or assets relative to shareholders' equity, comes in at 1.06 for SITIME CORP; that's greater than it is for just 7.61% of US stocks.
- If you're looking for stocks that are quantitatively similar to SITIME CORP, a group of peers worth examining would be SNAP, LAZR, AMBA, MPWR, and COIN.
- Visit SITM's SEC page to see the company's official filings. To visit the company's web site, go to www.sitime.com.
SITM Valuation Summary
- In comparison to the median Technology stock, SITM's price/sales ratio is 374.07% higher, now standing at 12.8.
- Over the past 46 months, SITM's price/earnings ratio has gone down 19.5.
Below are key valuation metrics over time for SITM.
Stock | Date | P/S | P/B | P/E | EV/EBIT |
---|---|---|---|---|---|
SITM | 2023-09-15 | 12.8 | 3.6 | -67.2 | -66.6 |
SITM | 2023-09-14 | 12.7 | 3.6 | -66.3 | -65.8 |
SITM | 2023-09-13 | 12.3 | 3.5 | -64.4 | -63.8 |
SITM | 2023-09-12 | 12.4 | 3.5 | -64.9 | -64.3 |
SITM | 2023-09-11 | 12.3 | 3.5 | -64.3 | -63.7 |
SITM | 2023-09-08 | 12.6 | 3.5 | -65.8 | -65.3 |
SITM's Quality Factors
The “Quality” component of the POWR Ratings focuses on 31 different factors of a companies fundamentals and operational strength. Here are some key insights as we drill into the specifics of these quality attributes.- SITM has a Quality Grade of C, ranking ahead of 56.37% of graded US stocks.
- SITM's asset turnover comes in at 0.664 -- ranking 111th of 208 Electronic Equipment stocks.
- 500 - Internal server error
The table below shows SITM's key quality metrics over time.
Period | Asset Turnover | Gross Margin | ROIC |
---|---|---|---|
2021-06-30 | 0.664 | 0.547 | -0.001 |
2021-03-31 | 0.699 | 0.514 | -0.157 |
2020-12-31 | 0.849 | 0.499 | -0.184 |
2020-09-30 | 0.778 | 0.484 | -0.202 |
SITM Price Target
For more insight on analysts targets of SITM, see our SITM price target page. And for a list of of all stocks sorted by upside potential based on analyst target price, see our Top Price Target page.
Average Price Target | $210.67 | Average Broker Recommendation | 1.36 (Strong Buy) |
Sitime Corporation (SITM) Company Bio
Sitime Corporation develops silicon-based timing solutions. The Company manufacturers oscillators, clock generators, and embedded resonators used for ethernet switches, computing devices, graphics cards, disk drives, mobile phones, and subscriber identity module cards. Sitime serves customers worldwide.
Latest SITM News From Around the Web
Below are the latest news stories about SITIME CORP that investors may wish to consider to help them evaluate SITM as an investment opportunity.
What Makes SiTime Corporation (SITM) an Attractive Investment?Polen Capital, an investment management company, released its “Polen U.S. SMID Company Growth Strategy” second-quarter 2023 investor letter. A copy of the same can be downloaded here. The portfolio returned 5.94% gross and 5.82% net of fees in the second quarter compared to a 6.42% return for the Russell 2500 Growth Index. The quarter showed an […] |
SiTime (SITM) Q2 2023 Earnings Call TranscriptOn today's call from SiTime are Rajesh Vashist, CEO; and Art Chadwick, CFO. Before we begin, I'd like to point out that during the course of this call, the company may make forward-looking statements regarding expected future results, including financial position, strategy and plans, future operations, the timing market, and other areas of discussion. |
SiTime Reports Second Quarter 2023 Financial ResultsSANTA CLARA, Calif., Aug. 02, 2023 (GLOBE NEWSWIRE) -- SiTime Corporation, (Nasdaq: SITM), the precision timing company, today announced financial results for the second quarter ended June 30, 2023. Net revenue in the second quarter of 2023 was $27.7 million, a 27.7% decrease from the $38.3 million in the first quarter of 2023. Generally Accepted Accounting Principles (GAAP) Results In the second quarter of 2023, GAAP gross margins were $15.4 million, or 55.7% of revenue, GAAP operating expenses |
SiTime Corporation to Announce Second Quarter 2023 Financial Results on August 2, 2023SANTA CLARA, Calif., July 06, 2023 (GLOBE NEWSWIRE) -- SiTime Corporation (Nasdaq: SITM), the precision timing company, will announce its second quarter 2023 financial results on Wednesday, August 2, 2023, after market close. Rajesh Vashist, SiTime’s chief executive officer, and Art Chadwick, chief financial officer, will broadcast a conference call at 2:00 p.m. Pacific Time to discuss the company’s results. Analysts and investors are invited to join the conference call using the following infor |
Palo Alto Networks Set to S&P 500; Others to Join S&P MidCap 400 and S&P SmallCap 600S&P Dow Jones Indices ("S&P DJI") will make the following changes to the S&P 500, S&P MidCap 400, and S&P SmallCap 600 indices effective prior to the open of trading on Tuesday, June 20, to coincide with the quarterly rebalance. The U.S. equity markets will be closed on Monday, June 19 in observance of the Juneteenth holiday. The changes ensure each index is more representative of its market capitalization range. All companies moving to the S&P MidCap 400 are more representative of the mid-cap m |
SITM Price Returns
1-mo | -14.76% |
3-mo | -6.90% |
6-mo | -19.77% |
1-year | 31.40% |
3-year | 42.62% |
5-year | N/A |
YTD | 5.18% |
2022 | -65.26% |
2021 | 161.36% |
2020 | 338.94% |
2019 | N/A |
2018 | N/A |
Loading social stream, please wait...