SVB Financial Group (SIVB): Price and Financial Metrics

SVB Financial Group (SIVB): $39.40

-66.64 (-62.84%)

POWR Rating

Component Grades

Growth

S

Value

I

Momentum

G

Stability

N

Sentiment

U

Quality

P

SIVB Price/Volume Stats

Current price $39.40 52-week high $597.16
Prev. close $106.04 52-week low $39.40
Day low $39.40 Volume 11,307,313
Day high $39.40 Avg. volume 1,899,047
50-day MA $272.71 Dividend yield N/A
200-day MA $328.85 Market Cap 2.33B

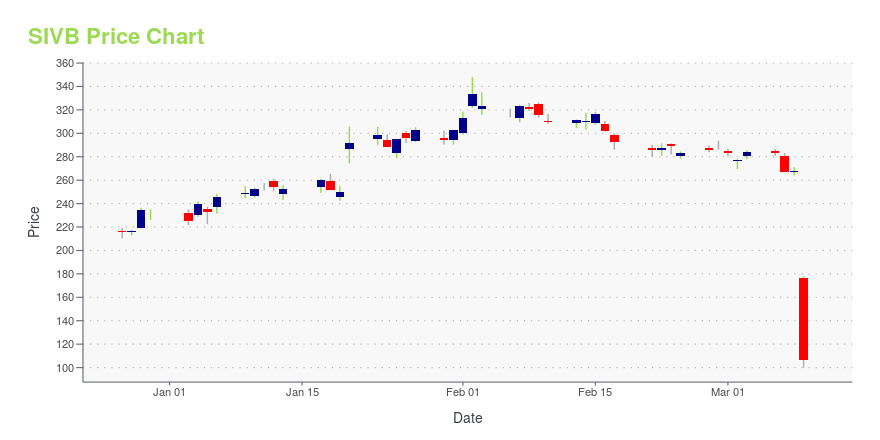
SIVB Stock Price Chart Interactive Chart >

SIVB POWR Grades

  • SIVB scores best on the Momentum dimension, with a Momentum rank ahead of 86.77% of US stocks.
  • The strongest trend for SIVB is in Stability, which has been heading down over the past 178 days.
  • SIVB's current lowest rank is in the Sentiment metric (where it is better than 8.97% of US stocks).

SIVB Stock Summary

  • SIVB's equity multiplier -- a measure of assets relative to shareholders'equity -- is greater than that of 95.56% of US stocks.
  • With a year-over-year growth in debt of 528.39%, SVB FINANCIAL GROUP's debt growth rate surpasses 96.72% of about US stocks.
  • SVB FINANCIAL GROUP's shareholder yield -- a measure of how much capital is returned to stockholders via dividends and buybacks -- is -96.61%, greater than the shareholder yield of merely 5.87% of stocks in our set.
  • Stocks with similar financial metrics, market capitalization, and price volatility to SVB FINANCIAL GROUP are KEY, WBS, DGX, PKG, and FITB.
  • SIVB's SEC filings can be seen here. And to visit SVB FINANCIAL GROUP's official web site, go to www.svb.com.

SIVB Valuation Summary

  • In comparison to the median Financial Services stock, SIVB's price/sales ratio is 0% higher, now standing at 2.9.
  • SIVB's price/sales ratio has moved up 0.4 over the prior 243 months.

Below are key valuation metrics over time for SIVB.

Stock Date P/S P/B P/E EV/EBIT
SIVB 2023-03-01 2.9 1.0 11.1 10.0
SIVB 2023-02-28 2.9 1.1 11.3 10.1
SIVB 2023-02-27 2.9 1.1 11.2 10.1
SIVB 2023-02-24 2.9 1.0 11.1 10.0
SIVB 2023-02-23 2.9 1.1 10.6 8.6
SIVB 2023-02-22 2.9 1.1 10.6 8.6

SIVB Growth Metrics

    Its 4 year cash and equivalents growth rate is now at 151.9%.
  • Its 2 year cash and equivalents growth rate is now at 115.51%.
  • Its 5 year cash and equivalents growth rate is now at 151.9%.
Over the past 49 months, SIVB's revenue has gone up $3,470,691,000.

The table below shows SIVB's growth in key financial areas (numbers in millions of US dollars).

Date Revenue Operating Cash Flow Net Income to Common Stock
2022-09-30 5,858 2,527 1,605
2022-06-30 5,876 2,528 1,541
2022-03-31 5,997 1,957.078 1,710
2021-12-31 5,794 1,812 1,770
2021-09-30 5,593.776 1,521.196 1,787.536
2021-06-30 5,218.117 1,395.009 1,864.249

SIVB's Quality Factors

The “Quality” component of the POWR Ratings focuses on 31 different factors of a companies fundamentals and operational strength. Here are some key insights as we drill into the specifics of these quality attributes.
  • SIVB has a Quality Grade of D, ranking ahead of 19.41% of graded US stocks.
  • SIVB's asset turnover comes in at 0.04 -- ranking 173rd of 428 Banking stocks.
  • LC, BPOP, and PEBK are the stocks whose asset turnover ratios are most correlated with SIVB.

The table below shows SIVB's key quality metrics over time.

Period Asset Turnover Gross Margin ROIC
2021-06-30 0.040 1 0.023
2021-03-31 0.042 1 0.023
2020-12-31 0.040 1 0.021
2020-09-30 0.041 1 0.020
2020-06-30 0.040 1 0.018
2020-03-31 0.044 1 0.022

SIVB Price Target

For more insight on analysts targets of SIVB, see our SIVB price target page. And for a list of of all stocks sorted by upside potential based on analyst target price, see our Top Price Target page.

Average Price Target $671.65 Average Broker Recommendation 1.58 (Moderate Buy)

SVB Financial Group (SIVB) Company Bio


Silicon Valley Bank, a subsidiary of SVB Financial Group, is a U.S.-based high-tech commercial bank. The bank has helped fund more than 30,000 start-ups.[2] SVB is on the list of largest banks in the United States, and is the biggest bank in Silicon Valley based on local deposits. (Source:Wikipedia)


SIVB Latest News Stream


Event/Time News Detail
Loading, please wait...

SIVB Latest Social Stream


Loading social stream, please wait...

View Full SIVB Social Stream

Latest SIVB News From Around the Web

Below are the latest news stories about SVB FINANCIAL GROUP that investors may wish to consider to help them evaluate SIVB as an investment opportunity.

SVB Financial confirms that Goldman was buyer of underwater securities last week

SVB Financial (NASDAQ:SIVB) confirmed that Silicon Valley Bank sold a portfolio of securities with a book value of $23.97 billion to Goldman Sachs (GS) last week before the bank was shut down by the FDIC. 

The sale of the portfolio to Goldman resulted in a net loss for Silicon Valley Bank of about $1.8 billion, according to an 8-K filing<...

Seeking Alpha | March 14, 2023

Fed to consider tough rules for midsize banks following SVB failure- report

  • The Federal Reserve is evaluating tougher rules for midsize banks after the failures of Silicon Valley Bank (NASDAQ:SIVB) and Signature Bank (NASDAQ:SBNY).
  • The regulator is looking at tougher capital and liquidity requirements and is looking to beef up annual "stress tests" that assess banks ability to weather a potential recession, according to aSeeking Alpha | March 14, 2023

Silicon Valley Bank - How Worried Should We Be?

The financial world has been rocked over the past few days. Shockwaves from this very fluid situation are still in process.

TalkMarkets.com | March 14, 2023

The Big Mistake That Led To Silicon Valley Bank's Crash

The Trump-era rollback of banking regulations was a big mistake.

TalkMarkets.com | March 14, 2023

Yes, The Latest Bank Bailout Is Really A Bailout, And You Are Paying For It.

The FDIC was never intended to insure rich people with deposits well in excess of FDIC insurance maximums. Yet that is exactly what is now happening.

TalkMarkets.com | March 14, 2023

Read More 'SIVB' Stories Here

SIVB Price Returns

1-mo N/A
3-mo -86.22%
6-mo -82.02%
1-year -91.99%
3-year -81.73%
5-year -87.17%
YTD -82.88%
2022 -66.07%
2021 74.88%
2020 54.49%
2019 32.18%
2018 -18.76%

Continue Researching SIVB

Want to see what other sources are saying about Svb Financial Group's financials and stock price? Try the links below:

Svb Financial Group (SIVB) Stock Price | Nasdaq
Svb Financial Group (SIVB) Stock Quote, History and News - Yahoo Finance
Svb Financial Group (SIVB) Stock Price and Basic Information | MarketWatch

Get Free Updates

Join thousands of investors who get the latest news, insights and top rated picks from StockNews.com!


Page generated in 0.7427 seconds.