
Beauty Health Co. (SKIN): Price and Financial Metrics
SKIN Price/Volume Stats
| Current price | $1.79 | 52-week high | $8.68 |
| Prev. close | $1.82 | 52-week low | $1.35 |
| Day low | $1.71 | Volume | 1,851,633 |
| Day high | $1.83 | Avg. volume | 2,149,435 |
| 50-day MA | $2.07 | Dividend yield | N/A |
| 200-day MA | $3.07 | Market Cap | 221.30M |
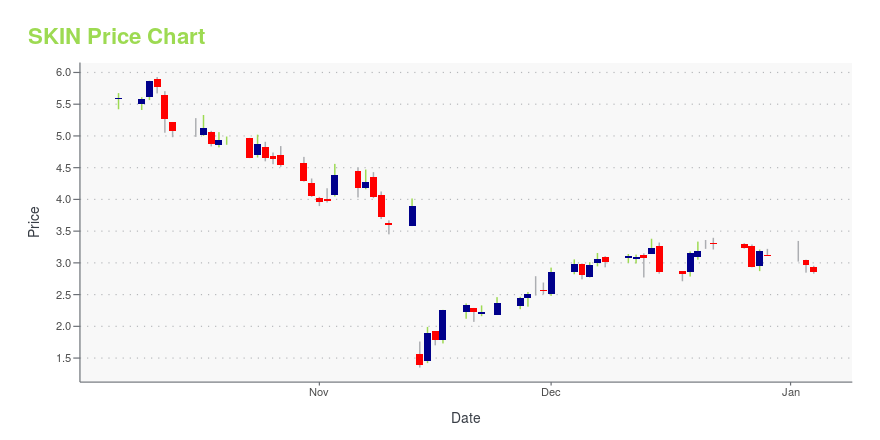
SKIN Stock Price Chart Interactive Chart >
Beauty Health Co. (SKIN) Company Bio
The Beauty Health Company designs, develops, manufactures, markets, and sells aesthetic technologies and products worldwide. The company offers HydraFacial and PERK hydradermabrasion systems that enhance the skin to cleanse, exfoliate, extract, and hydrate simultaneously; HydraFacial Daily Essentials, which provide detoxification, rejuvenation, and protection of skin; crystal microdermabrasion systems; and light emitting diode systems. It also operates HydraFacial CONNECT, an esthetics certification program that provides training through live online education programs. The company was founded in 1997 and is headquartered in Long Beach, California.
Latest SKIN News From Around the Web
Below are the latest news stories about BEAUTY HEALTH CO that investors may wish to consider to help them evaluate SKIN as an investment opportunity.
BeautyHealth 2023 Skintuition Report: The Skin Health Trends and Data Shaping the YearLONG BEACH, Calif., December 12, 2023--BeautyHealth 2023 Skintuition Report: The Skin Health Trends and Data Shaping the Year |
TTWO Stock Alert: Deutsche Bank Upgrades Take-Two InteractiveTake-Two Interactive stock is rising higher on Tuesday after shares of TTWO were upgraded by Deutsche Bank and got a new price target. |
Why Is Beauty Health (SKIN) Stock Down 49% Today?Beauty Health stock is falling hard on Tuesday as investors in SKIN shares react to the company's latest earnings report. |
Why Is Fisker (FSR) Stock Down 16% Today?Fisker stock is falling hard on Tuesday as FSR investors react to a delivery guidance cut and weak earnings data for Q3 2023. |
Why Is Trivago (TRVG) Stock Moving Today?Trivago stock is on the move Tuesday as investors in TRVG react to a dividend payment and plans for an ADS ratio change. |
SKIN Price Returns
| 1-mo | -2.19% |
| 3-mo | -44.75% |
| 6-mo | -41.69% |
| 1-year | -78.12% |
| 3-year | -89.32% |
| 5-year | N/A |
| YTD | -42.44% |
| 2023 | -65.82% |
| 2022 | -62.33% |
| 2021 | 113.62% |
| 2020 | N/A |
| 2019 | N/A |
Loading social stream, please wait...