Skechers U.S.A., Inc. (SKX): Price and Financial Metrics
GET POWR RATINGS... FREE!
SKX POWR Grades
- SKX scores best on the Sentiment dimension, with a Sentiment rank ahead of 92.1% of US stocks.
- The strongest trend for SKX is in Value, which has been heading down over the past 177 days.
- SKX's current lowest rank is in the Stability metric (where it is better than 43.54% of US stocks).
SKX Stock Summary
- SKX has a higher market value than 80.93% of US stocks; more precisely, its current market capitalization is $6,973,788,856.
- The price/operating cash flow metric for SKECHERS USA INC is higher than 83.96% of stocks in our set with a positive cash flow.
- Of note is the ratio of SKECHERS USA INC's sales and general administrative expense to its total operating expenses; 87.12% of US stocks have a lower such ratio.
- Stocks that are quantitatively similar to SKX, based on their financial statements, market capitalization, and price volatility, are RL, TREX, FIZZ, HLNE, and FIVE.
- SKX's SEC filings can be seen here. And to visit SKECHERS USA INC's official web site, go to www.skechers.com.
SKX Valuation Summary
- SKX's price/earnings ratio is 18.5; this is 43.41% higher than that of the median Consumer Cyclical stock.
- SKX's EV/EBIT ratio has moved up 14.4 over the prior 243 months.
Below are key valuation metrics over time for SKX.
Stock | Date | P/S | P/B | P/E | EV/EBIT |
---|---|---|---|---|---|
SKX | 2023-03-22 | 0.9 | 1.9 | 18.5 | 17.0 |
SKX | 2023-03-21 | 0.9 | 2.0 | 18.8 | 17.3 |
SKX | 2023-03-20 | 0.9 | 1.9 | 18.3 | 16.9 |
SKX | 2023-03-17 | 0.9 | 1.9 | 18.5 | 17.0 |
SKX | 2023-03-16 | 0.9 | 1.9 | 18.6 | 17.1 |
SKX | 2023-03-15 | 0.9 | 1.9 | 18.0 | 16.6 |
SKX Growth Metrics
- The 4 year price growth rate now stands at 13.96%.
- Its year over year price growth rate is now at -24.92%.
- Its year over year revenue growth rate is now at 39.57%.

The table below shows SKX's growth in key financial areas (numbers in millions of US dollars).
Date | Revenue | Operating Cash Flow | Net Income to Common Stock |
---|---|---|---|
2022-09-30 | 7,213.647 | -83.927 | 699.935 |
2022-06-30 | 6,886.237 | 49.7 | 717.188 |
2022-03-31 | 6,676.206 | 91.163 | 764.153 |
2021-12-31 | 6,285.029 | 212.152 | 741.503 |
2021-09-30 | 5,961.859 | 527.695 | 392.362 |
2021-06-30 | 5,711.788 | 472.326 | 353.501 |
SKX's Quality Factors
The “Quality” component of the POWR Ratings focuses on 31 different factors of a companies fundamentals and operational strength. Here are some key insights as we drill into the specifics of these quality attributes.- SKX has a Quality Grade of C, ranking ahead of 61.65% of graded US stocks.
- SKX's asset turnover comes in at 1.016 -- ranking 15th of 32 Apparel stocks.
- CRI, OXM, and CAL are the stocks whose asset turnover ratios are most correlated with SKX.
The table below shows SKX's key quality metrics over time.
Period | Asset Turnover | Gross Margin | ROIC |
---|---|---|---|
2021-09-30 | 1.016 | 0.494 | 0.096 |
2021-06-30 | 0.982 | 0.491 | 0.088 |
2021-03-31 | 0.835 | 0.485 | 0.038 |
2020-12-31 | 0.824 | 0.476 | 0.025 |
2020-09-30 | 0.860 | 0.473 | 0.031 |
2020-06-30 | 0.919 | 0.474 | 0.043 |
SKX Price Target
For more insight on analysts targets of SKX, see our SKX price target page. And for a list of of all stocks sorted by upside potential based on analyst target price, see our Top Price Target page.
Average Price Target | $64.13 | Average Broker Recommendation | 1.43 (Moderate Buy) |
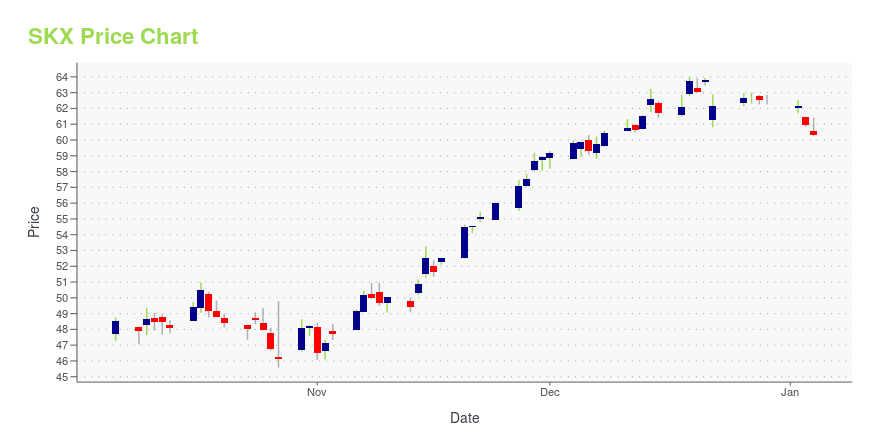
SKX Stock Price Chart Interactive Chart >
SKX Price/Volume Stats
Current price | $46.15 | 52-week high | $49.56 |
Prev. close | $45.75 | 52-week low | $31.28 |
Day low | $45.64 | Volume | 1,553,500 |
Day high | $46.68 | Avg. volume | 1,757,450 |
50-day MA | $45.25 | Dividend yield | N/A |
200-day MA | $40.01 | Market Cap | 7.16B |
Skechers U.S.A., Inc. (SKX) Company Bio
Skechers designs, develops and markets a diverse range of lifestyle footwear for men, women and children, as well as performance footwear for men and women. The company was founded in 1992 and is based in Manhattan Beach, California.
Latest SKX News From Around the Web
Below are the latest news stories about SKECHERS USA INC that investors may wish to consider to help them evaluate SKX as an investment opportunity.
Skechers (SKX) Rides High on Growth Strategies: Apt to HoldSkechers (SKX) is gaining on solid direct-to-consumer sales and Comfort Technology footwear. Its international business also appears encouraging. |
When Should You Buy Skechers U.S.A., Inc. (NYSE:SKX)?Skechers U.S.A., Inc. ( NYSE:SKX ), is not the largest company out there, but it saw a decent share price growth in the... |
G-III Apparel (GIII) Q4 Earnings Miss, Sales Improve Y/YG-III Apparel (GIII) posts weak earnings results in fourth-quarter fiscal 2023. However, sales were impressive on gains from brands and higher sales at both units. |
Foot Locker (FL) Gears Up For Q4 Earnings: What to ExpectA tough macroeconomic backdrop including inflationary pressures might have weighed on Foot Locker's (FL) performance during the fourth quarter of fiscal 2022. |
What Makes Skechers U.S.A. (SKX) a Good Long-Term investment?Meridian Funds, managed by ArrowMark Partners, released its “Meridian Growth Fund” fourth quarter 2022 investor letter. A copy of the same can be downloaded here. In the fourth quarter, the fund returned 4.69% (net) compared to a 4.72% return for the Russell 2500 Growth Index. Positive factors during the quarter helped the fund’s performance. An emphasis […] |
SKX Price Returns
1-mo | 3.68% |
3-mo | 10.01% |
6-mo | 45.49% |
1-year | 11.50% |
3-year | 88.06% |
5-year | 18.67% |
YTD | 10.01% |
2022 | -3.34% |
2021 | 20.76% |
2020 | -16.79% |
2019 | 88.69% |
2018 | -39.51% |
Continue Researching SKX
Want to see what other sources are saying about Skechers Usa Inc's financials and stock price? Try the links below:Skechers Usa Inc (SKX) Stock Price | Nasdaq
Skechers Usa Inc (SKX) Stock Quote, History and News - Yahoo Finance
Skechers Usa Inc (SKX) Stock Price and Basic Information | MarketWatch
Loading social stream, please wait...