SkyWest, Inc. (SKYW): Price and Financial Metrics
SKYW Stock Summary
- With a one year PEG ratio of 376.58, Skywest Inc is expected to have a higher PEG ratio (a measure of how expensive a stock is relative to its expected earnings growth) than 89.21% of US stocks.
- The price/operating cash flow metric for Skywest Inc is higher than only 14.23% of stocks in our set with a positive cash flow.
- Revenue growth over the past 12 months for Skywest Inc comes in at -28.43%, a number that bests merely 14.24% of the US stocks we're tracking.
- Stocks that are quantitatively similar to SKYW, based on their financial statements, market capitalization, and price volatility, are CONN, FAMI, NICK, JBLU, and MIC.
- Visit SKYW's SEC page to see the company's official filings. To visit the company's web site, go to inc.skywest.com.
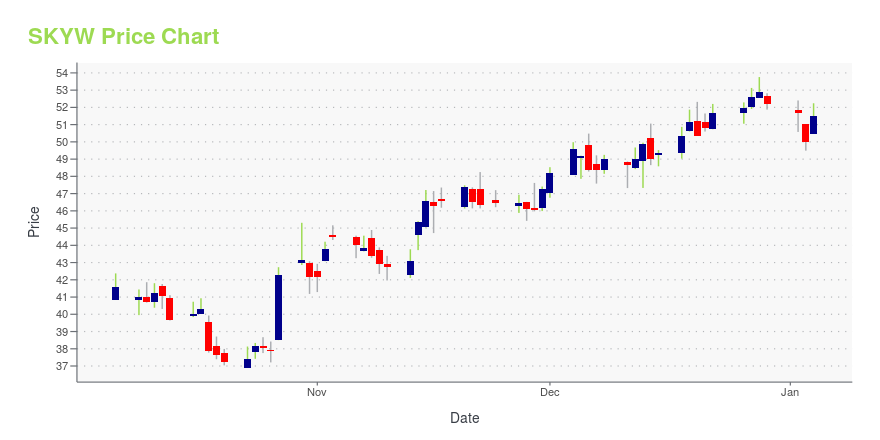
SKYW Stock Price Chart Interactive Chart >
SKYW Price/Volume Stats
Current price | $50.25 | 52-week high | $61.15 |
Prev. close | $50.84 | 52-week low | $21.14 |
Day low | $50.18 | Volume | 269,400 |
Day high | $52.08 | Avg. volume | 363,012 |
50-day MA | $54.35 | Dividend yield | N/A |
200-day MA | $40.02 | Market Cap | 2.53B |
SkyWest, Inc. (SKYW) Company Bio
Skywest Inc. operates a regional airline in the United States, providing scheduled passenger and air freight services to various destinations in the United States, Canada, Mexico, and the Caribbean. The company was founded in 1972 and is based in St. George, Utah.
SKYW Price Forecast Based on DCF Valuation
Current Price | DCF Fair Value Target: | Forecasted Gain: |
$50.25 | $391.28 | 670% |
Below please find a table outlining a discounted cash flow forecast for SKYW, in which we model out valuation assuming a variety of terminal growth rates. To summarize, we found that Skywest Inc ranked in the 87th percentile in terms of potential gain offered. More precisely, our analysis suggests the stock is undervalued by approximately 673.67% on a DCF basis. As for the metrics that stood out in our discounted cash flow analysis of Skywest Inc, consider:
- 42% of the company's capital comes from equity, which is greater than only 12.22% of stocks in our cash flow based forecasting set.
- The business' balance sheet reveals debt to be 58% of the company's capital (with equity being the remaining amount). Approximately 87.75% of US stocks with free cash flow have a lower reliance on debt in their capital structure.
- As a business, Skywest Inc experienced a tax rate of about 1% over the past twelve months; relative to its sector (Industrials), this tax rate is higher than only 21.78% of stocks generating free cash flow.
Terminal Growth Rate in Free Cash Flow | Return Relative to Current Share Price |
0% | 655% |
1% | 662% |
2% | 670% |
3% | 677% |
4% | 685% |
5% | 693% |
RCMT, NVEE, STCN, POWL, and PANL can be thought of as valuation peers to SKYW, in the sense that they are in the Industrials sector and have a similar price forecast based on DCF valuation.
Latest SKYW News From Around the Web
Below are the latest news stories about Skywest Inc that investors may wish to consider to help them evaluate SKYW as an investment opportunity.
1health to Provide its Suite of COVID-19 Tests to SkyWest Airlines1health, the leading Testing as a Service (TaaS) company, today announced that they have teamed up with SkyWest Airlines, a subsidiary of SkyWest, Inc. (NASDAQ: SKYW) to deliver two types of COVID-19 tests to the airline's employees nationwide. |
SkyWest, Inc. Announces First Quarter 2021 Results Call DateSkyWest, Inc. (NASDAQ: SKYW) will host a conference call after the market closes on Thursday, April 29, 2021 to discuss first quarter 2021 results. The format will include an overview of the quarterly results followed by a Q&A session. |
United Airlines Earns IBD Rating Upgrade As Americans Resume TravelUnited Airlines shows rising price performance, earning an upgrade to its IBD Relative Strength Rating |
Hawaiian Airlines Stock Soars Past Key Technical BenchmarkHawaiian Holdings shows improving price performance, earning an upgrade to its IBD Relative Strength Rating from 79 to 82. |
American Airlines Shows Rising Relative Strength; Is Air Travel Back?On Wednesday, American Airlines cleared a noteworthy technical benchmark, seeing its Relative Strength (RS) Rating jump into the 80-plus percentile with an improvement to 82, up from 79 the day before. Is AAL stock a good buy as the Covid-19 vaccine rollout starts and the Boeing 737 Max takes to the air again? American Airlines is now considered extended and out of buy range after clearing an 18.73 buy point in a first-stage cup without handle. |
SKYW Price Returns
1-mo | -3.14% |
3-mo | 18.29% |
6-mo | 48.93% |
1-year | 102.62% |
3-year | -7.61% |
5-year | 158.32% |
YTD | 24.66% |
2020 | -37.31% |
2019 | 46.54% |
2018 | -15.60% |
2017 | 46.83% |
2016 | 93.04% |
Continue Researching SKYW
Here are a few links from around the web to help you further your research on Skywest Inc's stock as an investment opportunity:Skywest Inc (SKYW) Stock Price | Nasdaq
Skywest Inc (SKYW) Stock Quote, History and News - Yahoo Finance
Skywest Inc (SKYW) Stock Price and Basic Information | MarketWatch
Loading social stream, please wait...