Silicon Laboratories, Inc. (SLAB): Price and Financial Metrics
SLAB Price/Volume Stats
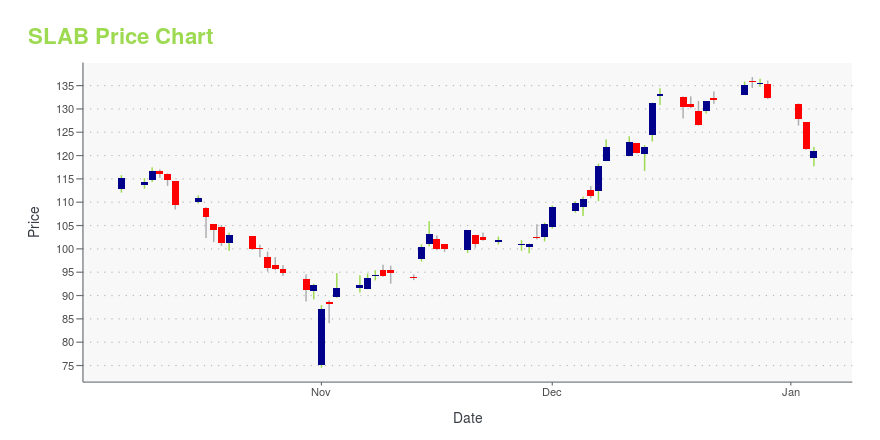
Current price | $142.32 | 52-week high | $194.68 |
Prev. close | $145.86 | 52-week low | $109.44 |
Day low | $140.86 | Volume | 694,100 |
Day high | $145.42 | Avg. volume | 546,911 |
50-day MA | $152.27 | Dividend yield | N/A |
200-day MA | $146.29 | Market Cap | 4.54B |
SLAB Stock Price Chart Interactive Chart >
SLAB POWR Grades
- Momentum is the dimension where SLAB ranks best; there it ranks ahead of 84.47% of US stocks.
- SLAB's strongest trending metric is Momentum; it's been moving up over the last 179 days.
- SLAB ranks lowest in Sentiment; there it ranks in the 6th percentile.
SLAB Stock Summary
- With a price/earnings ratio of 52.67, SILICON LABORATORIES INC P/E ratio is greater than that of about 89.26% of stocks in our set with positive earnings.
- Over the past twelve months, SLAB has reported earnings growth of -94.3%, putting it ahead of merely 15.64% of US stocks in our set.
- SILICON LABORATORIES INC's shareholder yield -- a measure of how much capital is returned to stockholders via dividends and buybacks -- is 16.84%, greater than the shareholder yield of 89.06% of stocks in our set.
- Stocks that are quantitatively similar to SLAB, based on their financial statements, market capitalization, and price volatility, are WDC, PRQR, WVE, CEVA, and UI.
- Visit SLAB's SEC page to see the company's official filings. To visit the company's web site, go to www.silabs.com.
SLAB Valuation Summary
- SLAB's price/sales ratio is 4.4; this is 79.59% higher than that of the median Technology stock.
- SLAB's price/sales ratio has moved down 2 over the prior 243 months.
Below are key valuation metrics over time for SLAB.
Stock | Date | P/S | P/B | P/E | EV/EBIT |
---|---|---|---|---|---|
SLAB | 2023-05-22 | 4.4 | 3.2 | 54.8 | 35.1 |
SLAB | 2023-05-19 | 4.3 | 3.2 | 54.3 | 34.7 |
SLAB | 2023-05-18 | 4.3 | 3.2 | 54.3 | 34.7 |
SLAB | 2023-05-17 | 4.3 | 3.1 | 54.0 | 34.5 |
SLAB | 2023-05-16 | 4.2 | 3.1 | 52.7 | 33.6 |
SLAB | 2023-05-15 | 4.2 | 3.1 | 52.9 | 33.8 |
SLAB Growth Metrics
- The 3 year cash and equivalents growth rate now stands at 231.36%.
- The year over year cash and equivalents growth rate now stands at 273.21%.
- Its year over year net cashflow from operations growth rate is now at -143.9%.

The table below shows SLAB's growth in key financial areas (numbers in millions of US dollars).
Date | Revenue | Operating Cash Flow | Net Income to Common Stock |
---|---|---|---|
2022-12-31 | 1,024.106 | 71.807 | 91.402 |
2022-09-30 | 975.461 | -160.424 | 62.943 |
2022-06-30 | 890.475 | -134.088 | 2,129 |
2022-03-31 | 796.817 | -39.741 | 2,126.797 |
2021-12-31 | 720.86 | -100.444 | 2,117.399 |
2021-09-30 | 852.745 | 126.684 | 2,129.445 |
SLAB's Quality Factors
The “Quality” component of the POWR Ratings focuses on 31 different factors of a companies fundamentals and operational strength. Here are some key insights as we drill into the specifics of these quality attributes.- SLAB has a Quality Grade of C, ranking ahead of 69.55% of graded US stocks.
- SLAB's asset turnover comes in at 0.363 -- ranking 164th of 208 Electronic Equipment stocks.
- AVNW, DQ, and SATS are the stocks whose asset turnover ratios are most correlated with SLAB.
The table below shows SLAB's key quality metrics over time.
Period | Asset Turnover | Gross Margin | ROIC |
---|---|---|---|
2021-10-02 | 0.363 | 0.584 | 1.567 |
2021-07-03 | 0.462 | 0.584 | 0.066 |
2021-04-03 | 0.480 | 0.592 | 0.054 |
2021-01-02 | 0.453 | 0.595 | 0.040 |
2020-10-03 | 0.460 | 0.601 | 0.038 |
2020-07-04 | 0.480 | 0.604 | 0.054 |
SLAB Price Target
For more insight on analysts targets of SLAB, see our SLAB price target page. And for a list of of all stocks sorted by upside potential based on analyst target price, see our Top Price Target page.
Average Price Target | $171.80 | Average Broker Recommendation | 1.73 (Moderate Buy) |
Silicon Laboratories, Inc. (SLAB) Company Bio
Silicon Laboratories designs, develops, and markets mixed-signal analog intensive integrated circuits. The company was founded in 1996 and is based in Austin, Texas.
Latest SLAB News From Around the Web
Below are the latest news stories about SILICON LABORATORIES INC that investors may wish to consider to help them evaluate SLAB as an investment opportunity.
Works With IoT Developer Conference Registration Opens, Silicon Labs' Premiere Event Runs Aug 22nd and 23rdSilicon Labs, a leader in secure, intelligent wireless technology for a more connected world, today opened registration for its fourth annual Works With Conference. The free virtual conference will be held on August 22nd and 23rd. The industry-leading developer conference will feature 40+ in-depth technical sessions covering every major IoT protocol and ecosystem. Taught by Silicon Labs engineers and other industry experts, the sessions are designed to demystify, simplify, and accelerate the dev |
The 5.6% return this week takes Silicon Laboratories' (NASDAQ:SLAB) shareholders three-year gains to 62%While Silicon Laboratories Inc. ( NASDAQ:SLAB ) shareholders are probably generally happy, the stock hasn't had... |
Silicon Labs to Present at Upcoming Investor ConferencesSilicon Labs (NASDAQ: SLAB), a leader in secure, intelligent wireless technology for a more connected world, today announced that the company will present at the following investor conferences: |
Why Silicon Labs Stock Fell Hard This WeekSilicon Labs (NASDAQ: SLAB) investors lost ground to the market this week. The semiconductor tech specialist's stock fell 18% through Thursday trading compared to a flat result for the S&P 500, according to data provided by S&P Global Market Intelligence. This move pushed Silicon Labs' shares to flat returns so far in 2023, compared to an 8% increase in the wider market. |
Impinj Stock Plummets As Tracking-Chip Maker Cuts OutlookTracking-chip maker Impinj posted mixed results for the first quarter and so the company guided lower for the current period. |
SLAB Price Returns
1-mo | 3.58% |
3-mo | -18.57% |
6-mo | -2.18% |
1-year | -4.94% |
3-year | 48.56% |
5-year | 31.78% |
YTD | 4.90% |
2022 | -34.27% |
2021 | 62.10% |
2020 | 9.79% |
2019 | 47.16% |
2018 | -10.75% |
Continue Researching SLAB
Want to do more research on Silicon Laboratories Inc's stock and its price? Try the links below:Silicon Laboratories Inc (SLAB) Stock Price | Nasdaq
Silicon Laboratories Inc (SLAB) Stock Quote, History and News - Yahoo Finance
Silicon Laboratories Inc (SLAB) Stock Price and Basic Information | MarketWatch
Loading social stream, please wait...