
Silgan Holdings Inc. (SLGN): Price and Financial Metrics
SLGN Price/Volume Stats
| Current price | $47.85 | 52-week high | $49.72 |
| Prev. close | $46.98 | 52-week low | $38.11 |
| Day low | $46.98 | Volume | 502,037 |
| Day high | $48.22 | Avg. volume | 574,923 |
| 50-day MA | $45.06 | Dividend yield | 1.66% |
| 200-day MA | $44.39 | Market Cap | 5.11B |
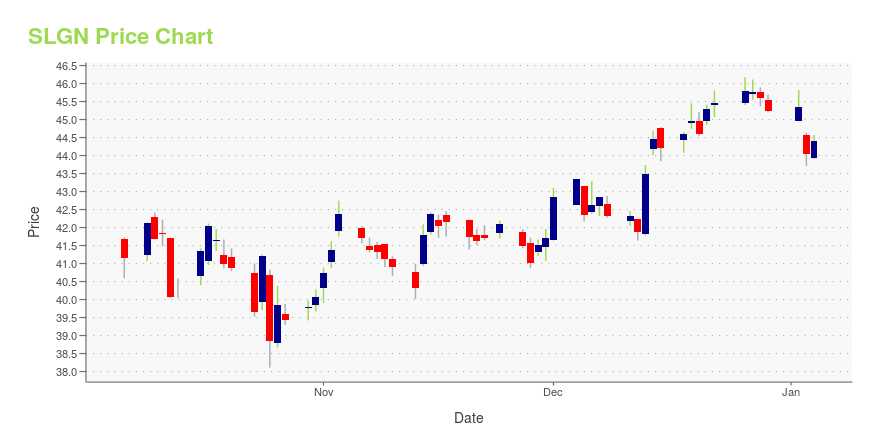
SLGN Stock Price Chart Interactive Chart >
Silgan Holdings Inc. (SLGN) Company Bio
Silgan Holdings is a leading supplier of metal containers in North America and Europe and a leading worldwide supplier of metal, composite and plastic closures for food and beverage products. In addition, Silgan is a leading supplier of plastic containers for shelf-stable food and personal care products in North America. The company was founded in 1987 and is based in Stamford, Connecticut.
Latest SLGN News From Around the Web
Below are the latest news stories about SILGAN HOLDINGS INC that investors may wish to consider to help them evaluate SLGN as an investment opportunity.
Silgan Declares Quarterly DividendSTAMFORD, Conn., October 31, 2023--Silgan Holdings Inc. (NYSE: SLGN), a leading supplier of sustainable rigid packaging solutions for the world's essential consumer goods products, announced today that its Board of Directors declared a quarterly cash dividend on its common stock. The Board of Directors approved an $0.18 per share quarterly cash dividend payable on December 15, 2023 to the holders of record of common stock of the Company on December 1, 2023. With this dividend payment, the Compan |
Silgan Announces Third Quarter 2023 ResultsSTAMFORD, Conn., October 25, 2023--SILGAN ANNOUNCES THIRD QUARTER 2023 RESULTS |
Silgan to Release Third Quarter 2023 Earnings Results on October 25, 2023STAMFORD, Conn., October 06, 2023--Silgan Holdings Inc. (NYSE: SLGN), a leading supplier of sustainable rigid packaging solutions for the world's essential consumer goods products, will release its third quarter 2023 earnings results on Wednesday, October 25, 2023, before the U.S. markets open. At 11:00 a.m. eastern time on that day, Silgan will hold a conference call to discuss the Company’s results and performance for this period. |
Silgan Announces Participation in Jefferies Industrials ConferenceSTAMFORD, Conn., September 01, 2023--Silgan Holdings Inc. (NYSE:SLGN), a leading supplier of sustainable rigid packaging solutions for the world’s essential consumer goods products, announced that it will participate in the Jefferies Industrials Conference on September 6, 2023. Robert Lewis, Executive Vice President, Corporate Development and Administration, and Alexander Hutter, Vice President, Investor Relations, are scheduled to speak at the conference starting at 11:00 a.m. eastern time, whi |
Silgan Announces Second Quarter 2023 ResultsSTAMFORD, Conn., July 26, 2023--Silgan Holdings Inc. (NYSE: SLGN), a leading supplier of sustainable rigid packaging solutions for the world's essential consumer goods products, today reported second quarter 2023 net sales of $1.43 billion and net income of $78.9 million, or $0.71 per diluted share, as compared to second quarter 2022 net sales of $1.54 billion and net income of $92.7 million, or $0.83 per diluted share. |
SLGN Price Returns
| 1-mo | 9.97% |
| 3-mo | 2.31% |
| 6-mo | 10.16% |
| 1-year | 12.18% |
| 3-year | 27.08% |
| 5-year | 67.36% |
| YTD | 6.63% |
| 2023 | -11.33% |
| 2022 | 22.68% |
| 2021 | 17.06% |
| 2020 | 21.06% |
| 2019 | 33.55% |
SLGN Dividends
| Ex-Dividend Date | Type | Payout Amount | Change | ||||||
|---|---|---|---|---|---|---|---|---|---|
| Loading, please wait... | |||||||||
Continue Researching SLGN
Want to see what other sources are saying about Silgan Holdings Inc's financials and stock price? Try the links below:Silgan Holdings Inc (SLGN) Stock Price | Nasdaq
Silgan Holdings Inc (SLGN) Stock Quote, History and News - Yahoo Finance
Silgan Holdings Inc (SLGN) Stock Price and Basic Information | MarketWatch
Loading social stream, please wait...