Super Micro Computer, Inc. (SMCI): Price and Financial Metrics
SMCI Price/Volume Stats
Current price | $272.65 | 52-week high | $357.00 |
Prev. close | $256.15 | 52-week low | $69.02 |
Day low | $254.61 | Volume | 3,157,500 |
Day high | $274.20 | Avg. volume | 2,581,908 |
50-day MA | $272.83 | Dividend yield | N/A |
200-day MA | $219.74 | Market Cap | 14.54B |
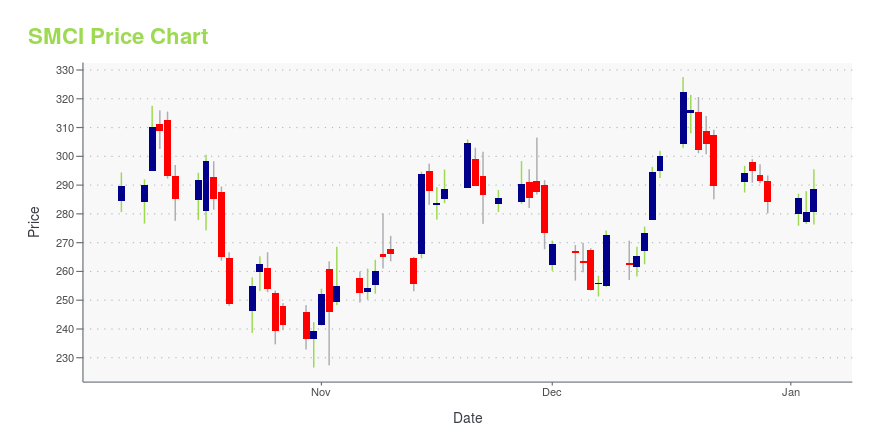
SMCI Stock Price Chart Interactive Chart >
SMCI POWR Grades
- SMCI scores best on the Quality dimension, with a Quality rank ahead of 79.53% of US stocks.
- SMCI's strongest trending metric is Momentum; it's been moving up over the last 177 days.
- SMCI ranks lowest in Stability; there it ranks in the 5th percentile.
SMCI Stock Summary
- SMCI has a market capitalization of $14,374,930,329 -- more than approximately 86.91% of US stocks.
- With a year-over-year growth in debt of -41.44%, SUPER MICRO COMPUTER INC's debt growth rate surpasses only 7.28% of about US stocks.
- In terms of volatility of its share price, SMCI is more volatile than 88.01% of stocks we're observing.
- If you're looking for stocks that are quantitatively similar to SUPER MICRO COMPUTER INC, a group of peers worth examining would be GNTX, OCUP, SWKS, MTNB, and HLTH.
- Visit SMCI's SEC page to see the company's official filings. To visit the company's web site, go to www.supermicro.com.
SMCI Valuation Summary
- In comparison to the median Technology stock, SMCI's price/earnings ratio is 3.49% lower, now standing at 24.9.
- SMCI's price/sales ratio has moved up 1.4 over the prior 203 months.
Below are key valuation metrics over time for SMCI.
Stock | Date | P/S | P/B | P/E | EV/EBIT |
---|---|---|---|---|---|
SMCI | 2023-11-28 | 2.1 | 7.0 | 24.9 | 20.8 |
SMCI | 2023-11-27 | 2.1 | 7.1 | 25.3 | 21.2 |
SMCI | 2023-11-24 | 2.1 | 7.0 | 24.9 | 20.8 |
SMCI | 2023-11-22 | 2.1 | 7.1 | 24.9 | 20.9 |
SMCI | 2023-11-21 | 2.1 | 7.1 | 25.2 | 21.1 |
SMCI | 2023-11-20 | 2.2 | 7.5 | 26.5 | 22.2 |
SMCI Growth Metrics
- Its 4 year net income to common stockholders growth rate is now at 51.39%.
- The year over year net cashflow from operations growth rate now stands at -860.49%.
- Its year over year price growth rate is now at 40.73%.

The table below shows SMCI's growth in key financial areas (numbers in millions of US dollars).
Date | Revenue | Operating Cash Flow | Net Income to Common Stock |
---|---|---|---|
2022-12-31 | 6,646.275 | 221.595 | 578.377 |
2022-09-30 | 6,015.499 | 7.357 | 444.142 |
2022-06-30 | 5,196.099 | -440.801 | 285.163 |
2022-03-31 | 4,629.624 | -352.095 | 183.503 |
2021-12-31 | 4,170.015 | -248.569 | 124.959 |
2021-09-30 | 3,827.902 | -132.171 | 110.701 |
SMCI's Quality Factors
The “Quality” component of the POWR Ratings focuses on 31 different factors of a companies fundamentals and operational strength. Here are some key insights as we drill into the specifics of these quality attributes.- SMCI has a Quality Grade of C, ranking ahead of 34.53% of graded US stocks.
- SMCI's asset turnover comes in at 1.79 -- ranking 2nd of 83 Computers stocks.
- 500 - Internal server error
The table below shows SMCI's key quality metrics over time.
Period | Asset Turnover | Gross Margin | ROIC |
---|---|---|---|
2021-06-30 | 1.790 | 0.150 | 0.116 |
2021-03-31 | 1.775 | 0.151 | 0.094 |
2020-12-31 | 1.719 | 0.160 | 0.095 |
2020-09-30 | 1.760 | 0.159 | 0.091 |
2020-06-30 | 1.808 | 0.158 | 0.097 |
2020-03-31 | 1.844 | 0.162 | 0.122 |
SMCI Price Target
For more insight on analysts targets of SMCI, see our SMCI price target page. And for a list of of all stocks sorted by upside potential based on analyst target price, see our Top Price Target page.
Average Price Target | $50.50 | Average Broker Recommendation | 1.5 (Moderate Buy) |
Super Micro Computer, Inc. (SMCI) Company Bio
Super Micro Computer, Inc. designs, develops, manufactures and sells server solutions based on modular and open-standard architecture. The Company offers servers, motherboards, chassis, and accessories. Super Micro Computer markets its products worldwide.
Latest SMCI News From Around the Web
Below are the latest news stories about SUPER MICRO COMPUTER INC that investors may wish to consider to help them evaluate SMCI as an investment opportunity.
3 No-Brainer Stocks You Must Own in 2024According to ING Economics, the Federal Reserve's interest rate hike cycle has not only come to an end but the central bank is expected to cut interest rates multiple times in 2024. This bodes well for the U.S. stock market. Investors keen to take advantage of the improving stock market sentiment can consider buying high-quality stocks riding strong tailwinds. |
Yih-Shyan (Wally) Liaw Joins Supermicro Board of DirectorsSAN JOSE, Calif., December 08, 2023--Super Micro Computer, Inc. (Nasdaq: SMCI), a Total IT Solution Manufacturer for AI, Cloud, Storage and 5G/Edge, today announced the appointment of Yih-Shyan (Wally) Liaw to the Board of Directors. |
Will Weakness in Super Micro Computer, Inc.'s (NASDAQ:SMCI) Stock Prove Temporary Given Strong Fundamentals?With its stock down 8.7% over the past three months, it is easy to disregard Super Micro Computer (NASDAQ:SMCI). But if... |
Insider Sell Alert: SVP, CFO David Weigand Sells 20,000 Shares of Super Micro Computer Inc (SMCI)Super Micro Computer Inc (NASDAQ:SMCI), a global leader in high-performance, high-efficiency server technology and innovation, has recently witnessed a significant insider sell by one of its top executives. |
Super Micro Computer (SMCI) Exceeds Market Returns: Some Facts to ConsiderSuper Micro Computer (SMCI) closed the most recent trading day at $256.15, moving +1.08% from the previous trading session. |
SMCI Price Returns
1-mo | 2.93% |
3-mo | -2.85% |
6-mo | 5.41% |
1-year | 224.51% |
3-year | 798.65% |
5-year | 1,567.58% |
YTD | 232.10% |
2022 | 86.80% |
2021 | 38.82% |
2020 | 31.81% |
2019 | 74.06% |
2018 | -34.05% |
Loading social stream, please wait...