
Smith Micro Software, Inc. (SMSI): Price and Financial Metrics
SMSI Price/Volume Stats
| Current price | $0.86 | 52-week high | $2.57 |
| Prev. close | $0.89 | 52-week low | $0.52 |
| Day low | $0.86 | Volume | 65,200 |
| Day high | $0.90 | Avg. volume | 223,154 |
| 50-day MA | $0.91 | Dividend yield | N/A |
| 200-day MA | $0.98 | Market Cap | 16.64M |
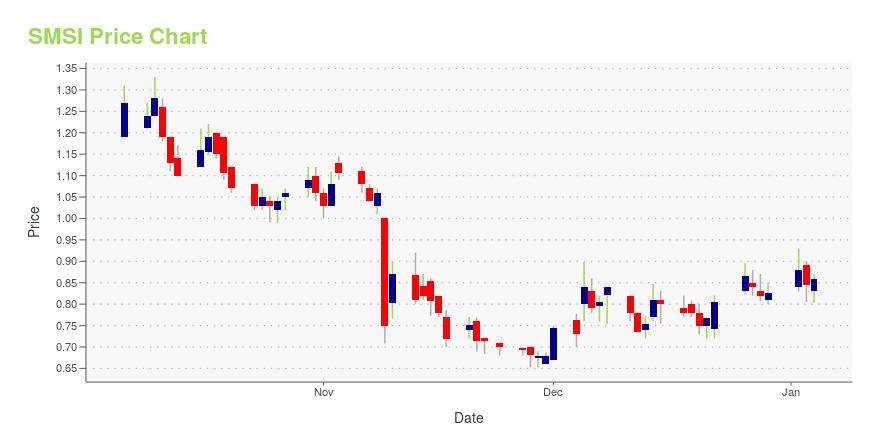
SMSI Stock Price Chart Interactive Chart >
SMSI Price Returns
| 1-mo | 8.85% |
| 3-mo | 0.12% |
| 6-mo | -32.28% |
| 1-year | -61.78% |
| 3-year | -95.83% |
| 5-year | -97.61% |
| YTD | -34.35% |
| 2024 | -80.18% |
| 2023 | -60.67% |
| 2022 | -57.32% |
| 2021 | -9.23% |
| 2020 | 36.18% |
Continue Researching SMSI
Want to do more research on Smith Micro Software Inc's stock and its price? Try the links below:Smith Micro Software Inc (SMSI) Stock Price | Nasdaq
Smith Micro Software Inc (SMSI) Stock Quote, History and News - Yahoo Finance
Smith Micro Software Inc (SMSI) Stock Price and Basic Information | MarketWatch
Loading social stream, please wait...