
Smith Micro Software, Inc. (SMSI): Price and Financial Metrics
SMSI Price/Volume Stats
| Current price | $2.57 | 52-week high | $14.96 |
| Prev. close | $2.48 | 52-week low | $1.88 |
| Day low | $2.45 | Volume | 14,100 |
| Day high | $2.57 | Avg. volume | 97,570 |
| 50-day MA | $2.33 | Dividend yield | N/A |
| 200-day MA | $4.55 | Market Cap | 24.68M |
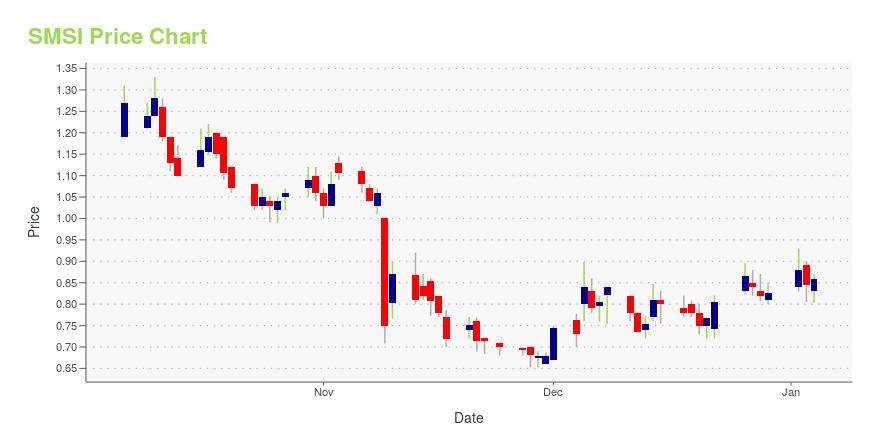
SMSI Stock Price Chart Interactive Chart >
Latest SMSI News From Around the Web
Below are the latest news stories about SMITH MICRO SOFTWARE INC that investors may wish to consider to help them evaluate SMSI as an investment opportunity.
Leading Tier 1 European Mobile Operator Signs New SafePath® Multiyear Contract with Smith MicroPITTSBURGH, December 05, 2023--Smith Micro Software, Inc. (Nasdaq: SMSI) announces that it has signed a multi-year agreement to provide its flagship SafePath® Digital Family Lifestyle™ solution to a major Tier 1 mobile network operator (MNO) in Europe. |
Bearish: Analysts Just Cut Their Smith Micro Software, Inc. (NASDAQ:SMSI) Revenue and EPS estimatesThe latest analyst coverage could presage a bad day for Smith Micro Software, Inc. ( NASDAQ:SMSI ), with the analysts... |
Smith Micro Software, Inc. (NASDAQ:SMSI) Q3 2023 Earnings Call TranscriptSmith Micro Software, Inc. (NASDAQ:SMSI) Q3 2023 Earnings Call Transcript November 8, 2023 Operator: Good day, and welcome to the Smith Micro Third Quarter 2023 Earnings Conference Call. All participants will be in a listen-only mode. [Operator Instructions] After today’s presentation there will be an opportunity to ask questions. [Operator Instructions] Please note this event […] |
Q3 2023 Smith Micro Software Inc Earnings CallQ3 2023 Smith Micro Software Inc Earnings Call |
Smith Micro Reports Third Quarter and Year-to-Date 2023 Financial ResultsPITTSBURGH, November 08, 2023--Smith Micro Software, Inc. (Nasdaq: SMSI) ("Smith Micro" or the "Company") today reported financial results for its third quarter ended September 30, 2023. |
SMSI Price Returns
| 1-mo | 15.25% |
| 3-mo | 10.78% |
| 6-mo | -61.58% |
| 1-year | -72.31% |
| 3-year | -94.21% |
| 5-year | -94.41% |
| YTD | -61.11% |
| 2023 | -60.67% |
| 2022 | -57.32% |
| 2021 | -9.23% |
| 2020 | 36.18% |
| 2019 | 121.11% |
Continue Researching SMSI
Want to do more research on Smith Micro Software Inc's stock and its price? Try the links below:Smith Micro Software Inc (SMSI) Stock Price | Nasdaq
Smith Micro Software Inc (SMSI) Stock Quote, History and News - Yahoo Finance
Smith Micro Software Inc (SMSI) Stock Price and Basic Information | MarketWatch
Loading social stream, please wait...