Snap-On Inc. (SNA): Price and Financial Metrics
GET POWR RATINGS... FREE!
SNA POWR Grades
- SNA scores best on the Quality dimension, with a Quality rank ahead of 96.21% of US stocks.
- The strongest trend for SNA is in Quality, which has been heading down over the past 177 days.
- SNA ranks lowest in Sentiment; there it ranks in the 28th percentile.
SNA Stock Summary
- SNA's went public 37.1 years ago, making it older than 93.53% of listed US stocks we're tracking.
- Of note is the ratio of SNAP-ON INC's sales and general administrative expense to its total operating expenses; 86.97% of US stocks have a lower such ratio.
- The volatility of SNAP-ON INC's share price is greater than that of just 9.42% US stocks with at least 200 days of trading history.
- Stocks with similar financial metrics, market capitalization, and price volatility to SNAP-ON INC are CNXC, RRX, RL, IVZ, and J.
- Visit SNA's SEC page to see the company's official filings. To visit the company's web site, go to www.snapon.com.
SNA Valuation Summary
- SNA's price/sales ratio is 2.7; this is 28.57% higher than that of the median Industrials stock.
- Over the past 243 months, SNA's EV/EBIT ratio has gone down 3.8.
Below are key valuation metrics over time for SNA.
Stock | Date | P/S | P/B | P/E | EV/EBIT |
---|---|---|---|---|---|
SNA | 2023-01-24 | 2.7 | 3.0 | 14.3 | 11.0 |
SNA | 2023-01-23 | 2.6 | 2.9 | 14.2 | 10.9 |
SNA | 2023-01-20 | 2.6 | 2.9 | 14.1 | 10.9 |
SNA | 2023-01-19 | 2.6 | 2.9 | 13.9 | 10.7 |
SNA | 2023-01-18 | 2.7 | 3.0 | 14.3 | 11.0 |
SNA | 2023-01-17 | 2.7 | 3.0 | 14.5 | 11.2 |
SNA Growth Metrics
- Its 4 year price growth rate is now at -36.15%.
- Its 5 year price growth rate is now at -36.15%.
- Its 2 year net cashflow from operations growth rate is now at 22.5%.

The table below shows SNA's growth in key financial areas (numbers in millions of US dollars).
Date | Revenue | Operating Cash Flow | Net Income to Common Stock |
---|---|---|---|
2022-09-30 | 4,793.5 | 687.3 | 896.5 |
2022-06-30 | 4,728.7 | 743.8 | 868.8 |
2022-03-31 | 4,674 | 841.2 | 845.3 |
2021-12-31 | 4,601.7 | 966.6 | 820.5 |
2021-09-30 | 4,574.3 | 1,061.5 | 805.7 |
2021-06-30 | 4,476.7 | 1,099.1 | 789.2 |
SNA's Quality Factors
The “Quality” component of the POWR Ratings focuses on 31 different factors of a companies fundamentals and operational strength. Here are some key insights as we drill into the specifics of these quality attributes.- SNA has a Quality Grade of A, ranking ahead of 96.38% of graded US stocks.
- SNA's asset turnover comes in at 0.688 -- ranking 45th of 60 Construction Materials stocks.
- B, CSTE, and PATK are the stocks whose asset turnover ratios are most correlated with SNA.
The table below shows SNA's key quality metrics over time.
Period | Asset Turnover | Gross Margin | ROIC |
---|---|---|---|
2021-10-02 | 0.688 | 0.517 | 0.237 |
2021-07-03 | 0.681 | 0.516 | 0.232 |
2021-04-03 | 0.643 | 0.509 | 0.200 |
2021-01-02 | 0.644 | 0.507 | 0.186 |
2020-09-26 | 0.645 | 0.505 | 0.176 |
2020-06-27 | 0.657 | 0.503 | 0.173 |
SNA Price Target
For more insight on analysts targets of SNA, see our SNA price target page. And for a list of of all stocks sorted by upside potential based on analyst target price, see our Top Price Target page.
Average Price Target | $237.63 | Average Broker Recommendation | 1.85 (Hold) |
SNA Stock Price Chart Interactive Chart >
SNA Price/Volume Stats
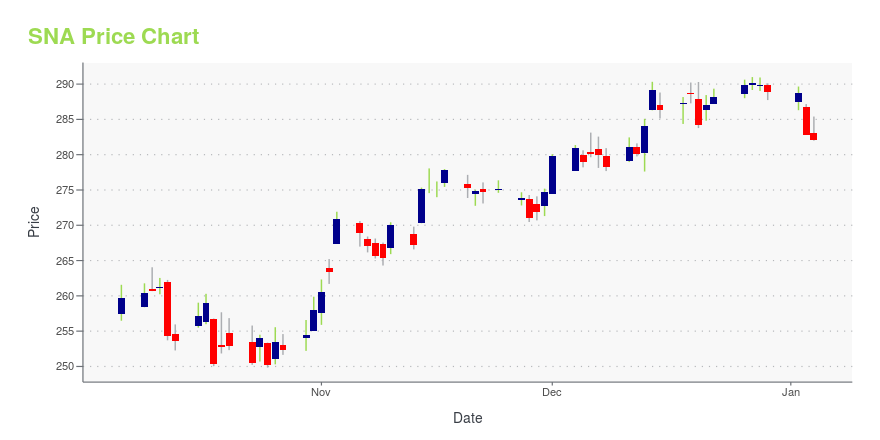
Current price | $244.45 | 52-week high | $250.63 |
Prev. close | $242.87 | 52-week low | $190.08 |
Day low | $241.98 | Volume | 240,400 |
Day high | $246.33 | Avg. volume | 267,850 |
50-day MA | $236.39 | Dividend yield | 2.65% |
200-day MA | $220.60 | Market Cap | 12.99B |
Snap-On Inc. (SNA) Company Bio
Snap-on Incorporated is an American designer, manufacturer and marketer of high-end tools and equipment for professional use in the transportation industry including the automotive, heavy duty, equipment, marine, aviation, and railroad industries. Headquartered in Kenosha, Wisconsin, Snap-on also distributes lower-end tools under the brand name Blue-Point. Their primary competitors include Matco, Mac Tools, Cornwell Tools, and Ko-Ken Tools. (Source:Wikipedia)
Latest SNA News From Around the Web
Below are the latest news stories about SNAP-ON INC that investors may wish to consider to help them evaluate SNA as an investment opportunity.
7 Undervalued Income Stocks to Buy in JanuaryWith many economic vagaries still on the horizon, investors may be better served with undervalued income stocks to buy. |
Snap-on Incorporated to Webcast 2022 Fourth Quarter and Full Year Results Conference CallKENOSHA, Wis.--(BUSINESS WIRE)--Snap-on will release 2022 fourth quarter and full year results prior to the market open on Thursday, February 2, 2023. |
Investors Shouldn't Overlook The Favourable Returns On Capital At Snap-on (NYSE:SNA)To find a multi-bagger stock, what are the underlying trends we should look for in a business? Firstly, we'll want to... |
Here's Why Investors Should Hold on to Snap-on (SNA) Stock NowSnap-On (SNA) looks well-poised on robust sales, and gains from its Value Creation model, RCI initiative and other cost-reduction plans despite cost inflation and currency woes. |
Why Snap-on Incorporated (NYSE:SNA) Could Be Worth WatchingToday we're going to take a look at the well-established Snap-on Incorporated ( NYSE:SNA ). The company's stock saw a... |
SNA Price Returns
1-mo | 6.98% |
3-mo | 10.85% |
6-mo | 11.75% |
1-year | 21.51% |
3-year | 61.96% |
5-year | 60.22% |
YTD | 6.98% |
2022 | 8.91% |
2021 | 28.83% |
2020 | 4.03% |
2019 | 19.54% |
2018 | -14.86% |
SNA Dividends
Ex-Dividend Date | Type | Payout Amount | Change | ||||||
---|---|---|---|---|---|---|---|---|---|
Loading, please wait... |
Continue Researching SNA
Here are a few links from around the web to help you further your research on Snap-on Inc's stock as an investment opportunity:Snap-on Inc (SNA) Stock Price | Nasdaq
Snap-on Inc (SNA) Stock Quote, History and News - Yahoo Finance
Snap-on Inc (SNA) Stock Price and Basic Information | MarketWatch
Loading social stream, please wait...