
Smart Sand, Inc. (SND): Price and Financial Metrics
SND Price/Volume Stats
| Current price | $2.17 | 52-week high | $2.48 |
| Prev. close | $2.11 | 52-week low | $1.65 |
| Day low | $2.11 | Volume | 31,556 |
| Day high | $2.17 | Avg. volume | 118,401 |
| 50-day MA | $2.13 | Dividend yield | N/A |
| 200-day MA | $2.03 | Market Cap | 92.39M |
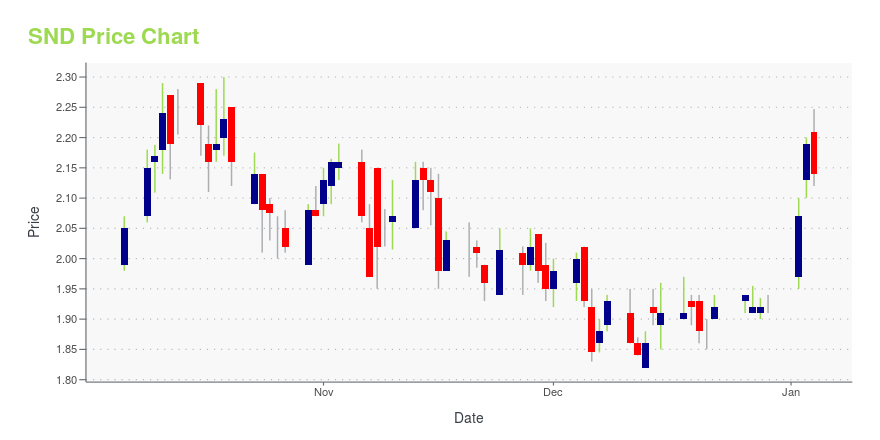
SND Stock Price Chart Interactive Chart >
Smart Sand, Inc. (SND) Company Bio
Smart Sand Partners LP focuses on the excavation, processing, and sale of industrial sand for use in hydraulic fracturing operations for the oil and gas industry. It produces Northern White frac sand, which is a preferred propant used to enhance hydrocarbon recovery rates in the hydraulic fracturing of oil and natural gas wells. The company owns and operates a sand mine and related processing facility on 1,168 contiguous acres near Oakdale, Wisconsin. Smart Sand GP LLC operates as a general partner of the company. Smart Sand Partners LP was founded in 2010 and is based in The Woodlands, Texas.
Latest SND News From Around the Web
Below are the latest news stories about SMART SAND INC that investors may wish to consider to help them evaluate SND as an investment opportunity.
3 Penny Stocks to Make You the Millionaire Next Door: 2024 EditionThese millionaire-maker penny stocks are perfect for investors seeking triple-digit returns over the next few years. |
Smart Sand, Inc. (NASDAQ:SND) Q3 2023 Earnings Call TranscriptSmart Sand, Inc. (NASDAQ:SND) Q3 2023 Earnings Call Transcript November 8, 2023 Operator: Good morning and welcome to the Smart Sand, Inc. Third quarter 2023 Earnings Conference Call. All participants will be in a listen-only mode. [Operator Instructions] Please note this event is being recorded. And now, I would like to turn the conference over […] |
Q3 2023 Smart Sand Inc Earnings CallQ3 2023 Smart Sand Inc Earnings Call |
Smart Sand, Inc. Announces Third Quarter 2023 Results3Q 2023 total tons sold of approximately 1.2 million3Q 2023 revenue of $76.9 million3Q 2023 net income of $6.7 million3Q 2023 adjusted EBITDA of $13.3 million3Q 2023 net cash provided by operating activities of $12.5 million3Q 2023 free cash flow of $5.6 million SPRING, Texas, Nov. 07, 2023 (GLOBE NEWSWIRE) -- Smart Sand, Inc. (NASDAQ: SND) (the “Company” or “Smart Sand”), a fully integrated frac and industrial sand supply and services company, a low-cost producer of high quality Northern White |
Smart Sand, Inc. Announces Timing of Third Quarter Earnings Release and Investor Conference CallSPRING, Texas, Oct. 20, 2023 (GLOBE NEWSWIRE) -- Smart Sand, Inc. (NASDAQ: SND) (“Smart Sand” or the “Company”) announced today that it will release its third quarter financial results after the market closes on Tuesday, November 7, 2023. The Company will hold a conference call for investors on Wednesday, November 8, 2023, at 10:00 a.m. Eastern Time to discuss recent events and the results. Chuck Young, the Company’s chief executive officer, Lee Beckelman, the Company’s chief financial officer, |
SND Price Returns
| 1-mo | 6.37% |
| 3-mo | -5.65% |
| 6-mo | 14.81% |
| 1-year | 22.60% |
| 3-year | -22.78% |
| 5-year | -3.13% |
| YTD | 12.44% |
| 2023 | 7.82% |
| 2022 | 0.56% |
| 2021 | 3.49% |
| 2020 | -31.75% |
| 2019 | 13.51% |
Continue Researching SND
Here are a few links from around the web to help you further your research on Smart Sand Inc's stock as an investment opportunity:Smart Sand Inc (SND) Stock Price | Nasdaq
Smart Sand Inc (SND) Stock Quote, History and News - Yahoo Finance
Smart Sand Inc (SND) Stock Price and Basic Information | MarketWatch
Loading social stream, please wait...