
Syndax Pharmaceuticals, Inc. (SNDX): Price and Financial Metrics
SNDX Price/Volume Stats
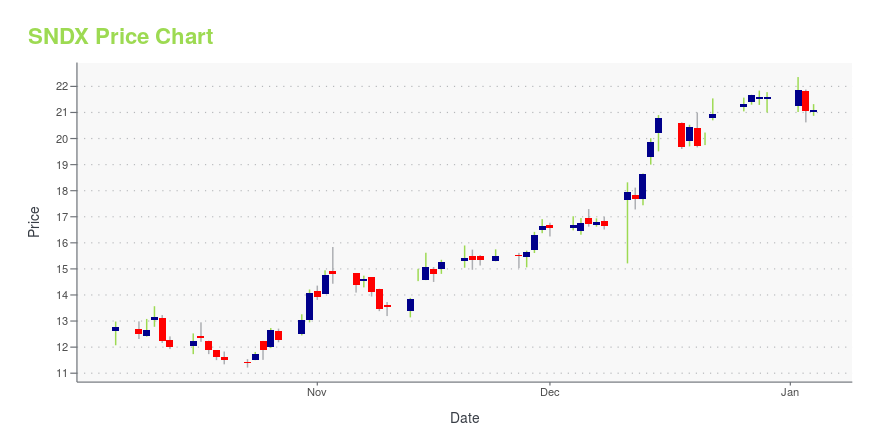
| Current price | $24.49 | 52-week high | $25.34 |
| Prev. close | $24.63 | 52-week low | $11.22 |
| Day low | $24.43 | Volume | 461,400 |
| Day high | $25.07 | Avg. volume | 1,096,935 |
| 50-day MA | $21.07 | Dividend yield | N/A |
| 200-day MA | $20.03 | Market Cap | 2.08B |
SNDX Stock Price Chart Interactive Chart >
Syndax Pharmaceuticals, Inc. (SNDX) Company Bio
Syndax Pharmaceuticals, Inc., a late-stage biopharmaceutical company, focuses on the development and commercialization of therapeutics in oncology. The company was founded in 2005 and is based in Waltham, Massachusetts.
Latest SNDX News From Around the Web
Below are the latest news stories about SYNDAX PHARMACEUTICALS INC that investors may wish to consider to help them evaluate SNDX as an investment opportunity.
With 85% ownership of the shares, Syndax Pharmaceuticals, Inc. (NASDAQ:SNDX) is heavily dominated by institutional ownersKey Insights Institutions' substantial holdings in Syndax Pharmaceuticals implies that they have significant influence... |
Syndax Announces Closing of Public Offering of Common Stock and Exercise in Full of the Underwriters' Option to Purchase Additional SharesSyndax Pharmaceuticals, Inc. ("Syndax," the "Company" or "we") (Nasdaq: SNDX), a clinical-stage biopharmaceutical company developing an innovative pipeline of cancer therapies, today announced the closing of its previously announced underwritten public offering of 12,432,431 shares of its common stock, which includes the exercise in full of the underwriters' option to purchase 1,621,621 additional shares. The public offering price of each share of common stock was $18.50. The aggregate gross pro |
12 Most Promising Cancer Stocks According to AnalystsIn this piece, we will take a look at the 12 most promising cancer stocks according to analysts. If you want to skip our overview of the latest trends in the cancer treatment sector, then you can take a look at the 5 Most Promising Cancer Stocks According to Analysts. The advent of technology and […] |
Syndax Announces Pricing of $200 Million Public Offering of Common StockSyndax Pharmaceuticals, Inc. ("Syndax" or the "Company") (Nasdaq: SNDX), a clinical-stage biopharmaceutical company developing an innovative pipeline of cancer therapies, today announced the pricing of an underwritten public offering of 10,810,810 shares of its common stock. The public offering price of each share of common stock is $18.50. The aggregate gross proceeds from this offering are expected to be approximately $200.0 million, before deducting underwriting discounts and commissions and |
Syndax Announces Proposed $150 Million Public Offering of Common StockSyndax Pharmaceuticals, Inc. ("Syndax" or the "Company") (Nasdaq: SNDX), a clinical-stage biopharmaceutical company developing an innovative pipeline of cancer therapies, today announced that it plans to offer and sell, subject to market and other conditions, $150 million of shares of its common stock in an underwritten public offering. Syndax also expects to grant the underwriters a 30-day option to purchase up to an additional 15% of the number of shares of common stock sold in the public offe |
SNDX Price Returns
| 1-mo | 23.19% |
| 3-mo | 16.29% |
| 6-mo | 21.12% |
| 1-year | 14.98% |
| 3-year | 71.14% |
| 5-year | 172.11% |
| YTD | 13.33% |
| 2023 | -15.09% |
| 2022 | 16.26% |
| 2021 | -1.57% |
| 2020 | 153.30% |
| 2019 | 97.30% |
Continue Researching SNDX
Here are a few links from around the web to help you further your research on Syndax Pharmaceuticals Inc's stock as an investment opportunity:Syndax Pharmaceuticals Inc (SNDX) Stock Price | Nasdaq
Syndax Pharmaceuticals Inc (SNDX) Stock Quote, History and News - Yahoo Finance
Syndax Pharmaceuticals Inc (SNDX) Stock Price and Basic Information | MarketWatch
Loading social stream, please wait...