
StoneX Group Inc. (SNEX): Price and Financial Metrics
SNEX Price/Volume Stats
| Current price | $83.07 | 52-week high | $83.60 |
| Prev. close | $82.24 | 52-week low | $57.46 |
| Day low | $82.41 | Volume | 115,700 |
| Day high | $83.60 | Avg. volume | 129,607 |
| 50-day MA | $75.45 | Dividend yield | N/A |
| 200-day MA | $69.03 | Market Cap | 2.63B |
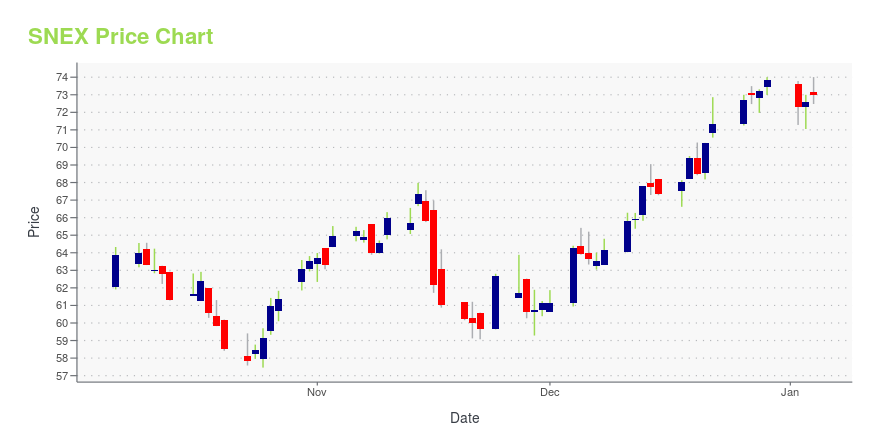
SNEX Stock Price Chart Interactive Chart >
StoneX Group Inc. (SNEX) Company Bio
StoneX Group Inc. is an institutional-grade financial services network that connects companies, organizations, and investors to the global markets ecosystem through digital platforms, end-to-end clearing, and execution services. StoneX Group operates worldwide.
Latest SNEX News From Around the Web
Below are the latest news stories about STONEX GROUP INC that investors may wish to consider to help them evaluate SNEX as an investment opportunity.
StoneX Announces Adoption of Swift’s Payment Pre-validation ServiceNEW YORK, Dec. 22, 2023 (GLOBE NEWSWIRE) -- StoneX is delighted to announce that it is one of the first financial organizations to enable Swift’s new leading-edge solution for cross-border payments. Cross-border payments have long been a complex area marked by ongoing regulatory and compliance changes, bank offline hours, and increasing competition. Swift has consistently played a pivotal role in facilitating such transactions, connecting a vast network of financial institutions as well as banks |
StoneX Group (NASDAQ:SNEX) jumps 5.0% this week, though earnings growth is still tracking behind five-year shareholder returnsWhen you buy a stock there is always a possibility that it could drop 100%. But on the bright side, if you buy shares... |
Is Now The Time To Put StoneX Group (NASDAQ:SNEX) On Your Watchlist?Investors are often guided by the idea of discovering 'the next big thing', even if that means buying 'story stocks... |
StoneX Group Inc. Reports Fiscal 2023 Fourth Quarter Financial ResultsRecord Fiscal Year Results in 2023, with Diluted EPS of $11.18, up 12% and ROE of 19.5% Quarterly Operating Revenues of $778.0 million, up 33% Quarterly Net Income of $50.7 million, ROE of 15.0% Quarterly Diluted EPS of $2.36 per share NEW YORK, Nov. 15, 2023 (GLOBE NEWSWIRE) -- StoneX Group Inc. (the “Company”; NASDAQ: SNEX), a global financial services network that connects companies, organizations, traders and investors to the global market ecosystem through a unique blend of digital platform |
StoneX Group Inc. to Announce 2023 Fiscal Fourth Quarter Earnings on November 15, 2023Conference call to follow on November 16, 2023 at 9:00am ETNEW YORK, Nov. 08, 2023 (GLOBE NEWSWIRE) -- StoneX Group Inc. (NASDAQ: SNEX) today announced that it will release its fiscal 2023 fourth quarter results after the market close on Wednesday, November 15, 2023. Management will host a conference call on Thursday, November 16, 2023 at 9:00 a.m. Eastern Time to review the Company's 2023 fiscal fourth quarter results. A live web cast of the conference call as well as additional information to |
SNEX Price Returns
| 1-mo | 14.41% |
| 3-mo | 16.10% |
| 6-mo | 23.36% |
| 1-year | 36.66% |
| 3-year | 97.50% |
| 5-year | 211.75% |
| YTD | 12.52% |
| 2023 | 16.21% |
| 2022 | 55.59% |
| 2021 | 5.79% |
| 2020 | 18.57% |
| 2019 | 33.49% |
Loading social stream, please wait...