Soligenix, Inc. (SNGX): Price and Financial Metrics
SNGX Price/Volume Stats
Current price | $0.69 | 52-week high | $10.35 |
Prev. close | $0.74 | 52-week low | $0.38 |
Day low | $0.63 | Volume | 405,500 |
Day high | $0.74 | Avg. volume | 778,892 |
50-day MA | $0.53 | Dividend yield | N/A |
200-day MA | $0.98 | Market Cap | 7.14M |
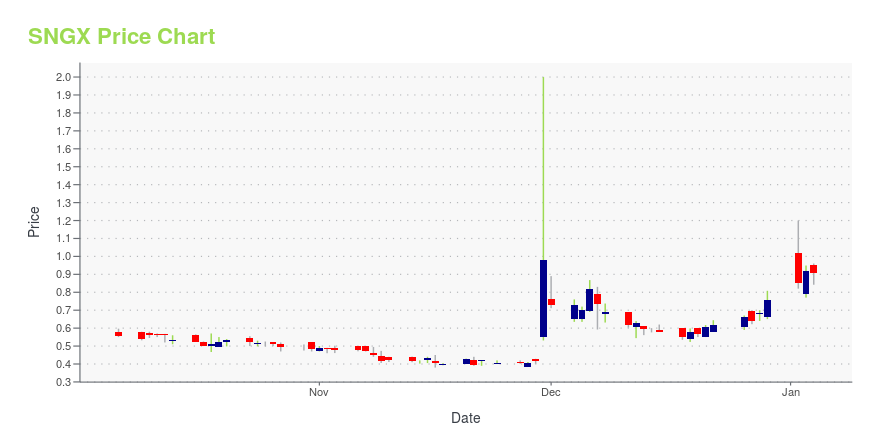
SNGX Stock Price Chart Interactive Chart >
SNGX POWR Grades
- Growth is the dimension where SNGX ranks best; there it ranks ahead of 73.7% of US stocks.
- The strongest trend for SNGX is in Sentiment, which has been heading up over the past 62 days.
- SNGX's current lowest rank is in the Stability metric (where it is better than 2.19% of US stocks).
SNGX Stock Summary
- SNGX has a market capitalization of $7,576,114 -- more than approximately just 4.54% of US stocks.
- With a year-over-year growth in debt of -69.01%, SOLIGENIX INC's debt growth rate surpasses only 3.05% of about US stocks.
- In terms of volatility of its share price, SNGX is more volatile than 96.61% of stocks we're observing.
- Stocks that are quantitatively similar to SNGX, based on their financial statements, market capitalization, and price volatility, are FBIO, BTAI, MEIP, TVTX, and PALI.
- Visit SNGX's SEC page to see the company's official filings. To visit the company's web site, go to www.soligenix.com.
SNGX Valuation Summary
- SNGX's price/sales ratio is 4.7; this is 23.68% higher than that of the median Healthcare stock.
- SNGX's price/earnings ratio has moved up 3.7 over the prior 243 months.
Below are key valuation metrics over time for SNGX.
Stock | Date | P/S | P/B | P/E | EV/EBIT |
---|---|---|---|---|---|
SNGX | 2023-11-20 | 4.7 | 1.1 | -0.6 | 0.3 |
SNGX | 2023-11-17 | 4.4 | 1.0 | -0.5 | 0.3 |
SNGX | 2023-11-16 | 4.4 | 1.0 | -0.5 | 0.3 |
SNGX | 2023-11-15 | 4.7 | 1.1 | -0.6 | 0.3 |
SNGX | 2023-11-14 | 4.5 | 1.0 | -0.5 | 0.3 |
SNGX | 2023-11-13 | 4.5 | 1.0 | -0.5 | 0.3 |
SNGX Growth Metrics
- Its 3 year price growth rate is now at -46.22%.
- The 3 year cash and equivalents growth rate now stands at 217.71%.
- Its 4 year cash and equivalents growth rate is now at 0.83%.

The table below shows SNGX's growth in key financial areas (numbers in millions of US dollars).
Date | Revenue | Operating Cash Flow | Net Income to Common Stock |
---|---|---|---|
2022-09-30 | 0.858496 | -12.07723 | -14.74866 |
2022-06-30 | 0.878554 | -11.86238 | -15.02721 |
2022-03-31 | 0.864738 | -10.99324 | -14.53752 |
2021-12-31 | 0.824268 | -11.73962 | -12.55097 |
2021-09-30 | 0.869409 | -12.80922 | -13.38736 |
2021-06-30 | 1.292022 | -12.76004 | -11.58997 |
SNGX's Quality Factors
The “Quality” component of the POWR Ratings focuses on 31 different factors of a companies fundamentals and operational strength. Here are some key insights as we drill into the specifics of these quality attributes.- SNGX has a Quality Grade of F, ranking ahead of 4.48% of graded US stocks.
- SNGX's asset turnover comes in at 0.055 -- ranking 317th of 682 Pharmaceutical Products stocks.
- AVDL, OTIC, and ICPT are the stocks whose asset turnover ratios are most correlated with SNGX.
The table below shows SNGX's key quality metrics over time.
Period | Asset Turnover | Gross Margin | ROIC |
---|---|---|---|
2021-06-30 | 0.055 | 0.261 | -2.934 |
2021-03-31 | 0.082 | 0.296 | -9.045 |
2020-12-31 | 0.171 | 0.228 | 13.842 |
2020-09-30 | 0.253 | 0.205 | 4.321 |
2020-06-30 | 0.353 | 0.185 | 4.346 |
2020-03-31 | 0.502 | 0.213 | 4.558 |
SNGX Price Target
For more insight on analysts targets of SNGX, see our SNGX price target page. And for a list of of all stocks sorted by upside potential based on analyst target price, see our Top Price Target page.
Average Price Target | $4.88 | Average Broker Recommendation | 1.75 (Moderate Buy) |
Soligenix, Inc. (SNGX) Company Bio
Soligenix, Inc. develops therapeutics and vaccines. The Company researches treatments for gastrointestinal Graft-versus-Host disease and cancer, and develops vaccines for military and civilian applications.
Latest SNGX News From Around the Web
Below are the latest news stories about SOLIGENIX INC that investors may wish to consider to help them evaluate SNGX as an investment opportunity.
Today’s Biggest Pre-Market Stock Movers: 10 Top Gainers and Losers on FridayIt's the final day of trading this week and we're starting it with a breakdown of the biggest pre-market stock movers on Friday morning! |
"HyBryte™ Use in Early-Stage Cutaneous T-Cell Lymphoma" Published in Frontiers in Drug DiscoverySoligenix, Inc. (Nasdaq: SNGX) (Soligenix or the Company), a late-stage biopharmaceutical company focused on developing and commercializing products to treat rare diseases where there is an unmet medical need, announced today that an article describing the potential use of HyBryte™ in the treatment of cutaneous T-cell lymphoma (CTCL) has been published in Frontiers in Drug Discovery. The mini-review summarizes findings about the use, mechanism and effectiveness of HyBryte™ in the treatment of CT |
Jefferies Is Pounding the Table on Snap (SNAP) StockSnap stock is heading higher on Thursday after the social media company's shares were upgraded to a 'buy' rating by Jefferies analysts. |
TSLA Stock Alert: The Tesla Cybertruck Launches TodayTesla stock is on the move Thursday as investors in TSLA shares prepare for the official Cybertruck launch event taking place today! |
Why Is Soligenix (SNGX) Stock Up 285% Today?Soligenix stock is rising higher on Thursday with heavy trading of SNGX shares after getting FDA approval for a Phase 2 clinical trial. |
SNGX Price Returns
1-mo | 65.87% |
3-mo | 38.00% |
6-mo | -3.50% |
1-year | -91.21% |
3-year | -98.07% |
5-year | -95.53% |
YTD | -89.82% |
2022 | -31.55% |
2021 | -48.41% |
2020 | -11.72% |
2019 | 68.60% |
2018 | -61.26% |
Continue Researching SNGX
Want to see what other sources are saying about Soligenix Inc's financials and stock price? Try the links below:Soligenix Inc (SNGX) Stock Price | Nasdaq
Soligenix Inc (SNGX) Stock Quote, History and News - Yahoo Finance
Soligenix Inc (SNGX) Stock Price and Basic Information | MarketWatch
Loading social stream, please wait...