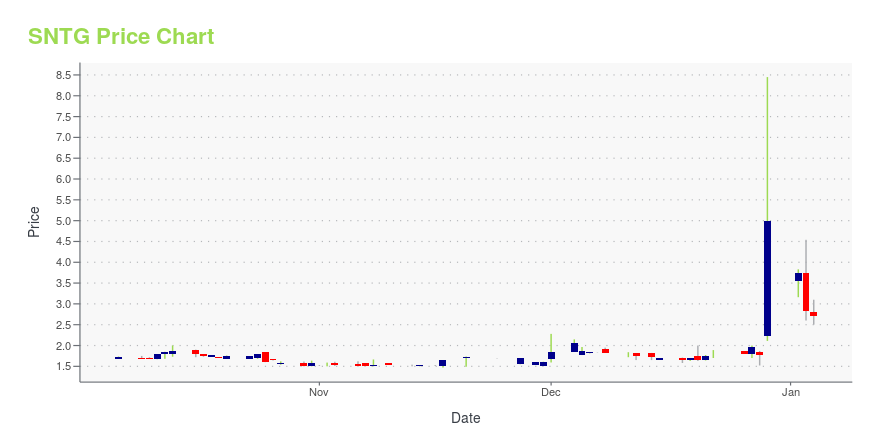
Sentage Holdings Inc. (SNTG): Price and Financial Metrics
SNTG Price/Volume Stats
| Current price | $2.82 | 52-week high | $8.45 |
| Prev. close | $2.74 | 52-week low | $1.47 |
| Day low | $2.54 | Volume | 28,100 |
| Day high | $2.85 | Avg. volume | 456,580 |
| 50-day MA | $2.23 | Dividend yield | N/A |
| 200-day MA | $2.18 | Market Cap | 7.91M |
SNTG Stock Price Chart Interactive Chart >
Sentage Holdings Inc. (SNTG) Company Bio
Sentage Holdings Inc. provides a range of financial services in consumer loan repayment and collection management, loan recommendation, and prepaid payment network services in China. The company was founded in 2009 and is based in Shanghai, the People's Republic of China.
Latest SNTG News From Around the Web
Below are the latest news stories about SENTAGE HOLDINGS INC that investors may wish to consider to help them evaluate SNTG as an investment opportunity.
Today’s Biggest Pre-Market Stock Movers: 10 Top Gainers and Losers on MondayIt's time to start of the trading week with a look at the biggest pre-market stock movers worth watching on Monday morning! |
Today’s Biggest Pre-Market Stock Movers: 10 Top Gainers and Losers on TuesdayIt's time for another dive into the biggest pre-market stock movers as we check out the most recent news for Tuesday morning! |
Today’s Biggest Pre-Market Stock Movers: 10 Top Gainers and Losers on WednesdayIt's time for another dive into the biggest pre-market stock movers as we check out all of the latest news for Wednesday! |
Sentage Holdings Full Year 2022 Earnings: US$1.08 loss per share (vs US$0.46 loss in FY 2021)Sentage Holdings ( NASDAQ:SNTG ) Full Year 2022 Results Key Financial Results Net loss: US$2.56m (loss widened by 134... |
SNTG Price Returns
| 1-mo | 36.23% |
| 3-mo | 43.88% |
| 6-mo | 16.53% |
| 1-year | 21.55% |
| 3-year | -87.55% |
| 5-year | N/A |
| YTD | -43.60% |
| 2023 | 160.42% |
| 2022 | -68.78% |
| 2021 | N/A |
| 2020 | N/A |
| 2019 | N/A |


Loading social stream, please wait...