
Sanofi - ADR (SNY): Price and Financial Metrics
SNY Price/Volume Stats
| Current price | $48.30 | 52-week high | $60.12 |
| Prev. close | $49.31 | 52-week low | $45.80 |
| Day low | $48.26 | Volume | 1,555,600 |
| Day high | $48.81 | Avg. volume | 2,622,776 |
| 50-day MA | $50.80 | Dividend yield | 3.24% |
| 200-day MA | $52.24 | Market Cap | 118.45B |
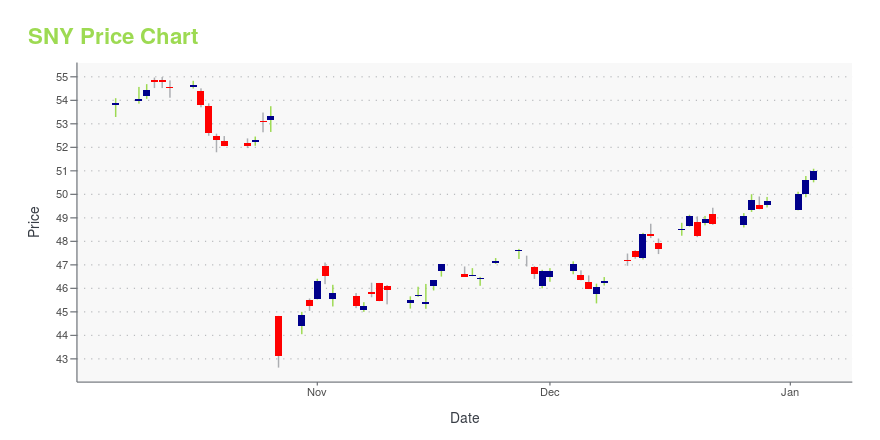
SNY Stock Price Chart Interactive Chart >
Sanofi - ADR (SNY) Company Bio
Sanofi researches, develops, manufactures, and markets various therapeutic solutions. The company operates in three segments: Pharmaceuticals, Vaccines, and Animal Health. The company was founded in 1973 and is based in Paris, France.
SNY Price Returns
| 1-mo | -2.42% |
| 3-mo | -4.14% |
| 6-mo | 3.49% |
| 1-year | N/A |
| 3-year | 5.07% |
| 5-year | N/A |
| YTD | 3.31% |
| 2024 | -0.07% |
| 2023 | 5.45% |
| 2022 | -1.00% |
| 2021 | 5.87% |
| 2020 | -0.83% |
SNY Dividends
| Ex-Dividend Date | Type | Payout Amount | Change | ||||||
|---|---|---|---|---|---|---|---|---|---|
| Loading, please wait... | |||||||||
Continue Researching SNY
Want to see what other sources are saying about Sanofi's financials and stock price? Try the links below:Sanofi (SNY) Stock Price | Nasdaq
Sanofi (SNY) Stock Quote, History and News - Yahoo Finance
Sanofi (SNY) Stock Price and Basic Information | MarketWatch
Loading social stream, please wait...