
Sanofi - ADR (SNY): Price and Financial Metrics
SNY Price/Volume Stats
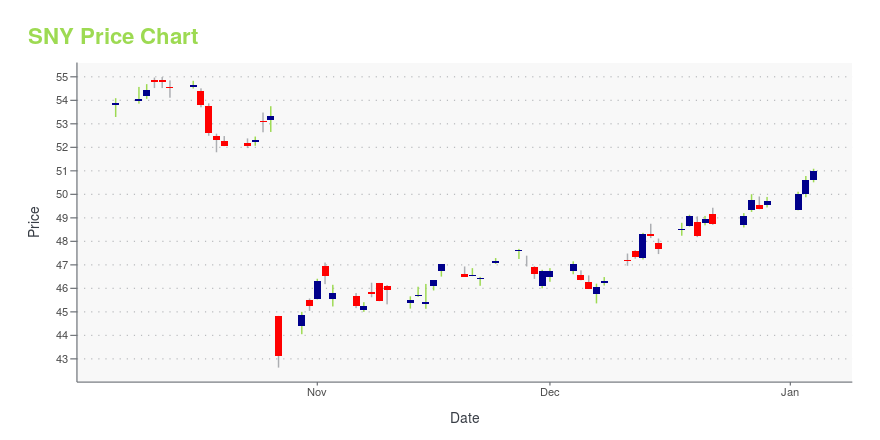
| Current price | $52.40 | 52-week high | $55.72 |
| Prev. close | $53.10 | 52-week low | $42.63 |
| Day low | $52.37 | Volume | 1,994,500 |
| Day high | $52.85 | Avg. volume | 2,153,595 |
| 50-day MA | $49.25 | Dividend yield | 2.93% |
| 200-day MA | $48.68 | Market Cap | 132.71B |
SNY Stock Price Chart Interactive Chart >
Sanofi - ADR (SNY) Company Bio
Sanofi researches, develops, manufactures, and markets various therapeutic solutions. The company operates in three segments: Pharmaceuticals, Vaccines, and Animal Health. The company was founded in 1973 and is based in Paris, France.
Latest SNY News From Around the Web
Below are the latest news stories about SANOFI that investors may wish to consider to help them evaluate SNY as an investment opportunity.
15 Undervalued Defensive Stocks For 2024In this article, we discuss the 15 undervalued defensive stocks for 2024. To skip the detailed overview of the market and defensive stocks, go directly to the 5 Undervalued Defensive Stocks For 2024. Defensive stocks are shares of companies that remain relatively stable during economic downturns as opposed to cyclical stocks. Defensive stocks usually outperform […] |
Sanofi (SNY) Discontinues Tusamitamab Ravtansine Cancer ProgramSanofi (SNY) stops the development of tusamitamab ravtansine after a phase III study on the candidate for second-line metastatic non-small cell lung cancer fails to meet the primary endpoint. |
Pharma Stock Roundup: FDA Nod to AZN's Eplontersen, CRL to MRK's Cough CandidateFDA approves AstraZeneca (AZN) and Ionis' (IONS) Wainua (eplontersen) for ATTRv-PN and gives CRL to Merck's chronic cough candidate, gefapixant. |
Sanofi scraps a top ADC prospect after study setbackThe drug, acquired via a deal with ImmunoGen, was the most advanced experimental medicine in the French pharma’s pipeline. |
Press Release: Sanofi announces end of program evaluating tusamitamab ravtansine after a 2L NSCLC Phase 3 trial did not meet a primary endpointSanofi announces end of program evaluating tusamitamab ravtansine after a 2L NSCLC Phase 3 trial did not meet a primary endpoint CARMEN-LC03 trial did not meet dual primary endpoint of improving progression-free survival; tusamitamab ravtansine clinical development program will be discontinuedSanofi reinforces commitment to broader oncology development program including CEACAM5-directed antibody drug conjugates (ADC) with additional anticipated trials PARIS, December 21, 2023. Sanofi is disconti |
SNY Price Returns
| 1-mo | 8.99% |
| 3-mo | 9.90% |
| 6-mo | 7.38% |
| 1-year | 2.88% |
| 3-year | 9.07% |
| 5-year | 38.83% |
| YTD | 8.57% |
| 2023 | 5.45% |
| 2022 | -1.00% |
| 2021 | 5.87% |
| 2020 | -0.83% |
| 2019 | 23.73% |
SNY Dividends
| Ex-Dividend Date | Type | Payout Amount | Change | ||||||
|---|---|---|---|---|---|---|---|---|---|
| Loading, please wait... | |||||||||
Continue Researching SNY
Want to see what other sources are saying about Sanofi's financials and stock price? Try the links below:Sanofi (SNY) Stock Price | Nasdaq
Sanofi (SNY) Stock Quote, History and News - Yahoo Finance
Sanofi (SNY) Stock Price and Basic Information | MarketWatch
Loading social stream, please wait...