SoFi Technologies Inc. (SOFI): Price and Financial Metrics
SOFI Price/Volume Stats
Current price | $7.40 | 52-week high | $11.70 |
Prev. close | $7.51 | 52-week low | $4.24 |
Day low | $7.37 | Volume | 22,523,490 |
Day high | $7.59 | Avg. volume | 41,626,930 |
50-day MA | $8.86 | Dividend yield | N/A |
200-day MA | $6.92 | Market Cap | 7.03B |
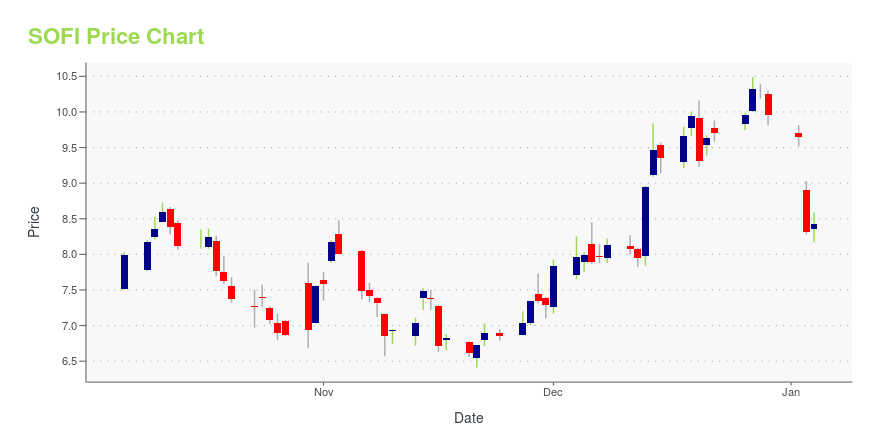
SOFI Stock Price Chart Interactive Chart >
SOFI POWR Grades
- SOFI scores best on the Growth dimension, with a Growth rank ahead of 77.97% of US stocks.
- SOFI's strongest trending metric is Momentum; it's been moving up over the last 177 days.
- SOFI's current lowest rank is in the Stability metric (where it is better than 2.7% of US stocks).
SOFI Stock Summary
- SOFI's went public 2.96 years ago, making it older than only 12.22% of listed US stocks we're tracking.
- With a year-over-year growth in debt of 69.09%, SOFI TECHNOLOGIES INC's debt growth rate surpasses 87.18% of about US stocks.
- As for revenue growth, note that SOFI's revenue has grown 48.01% over the past 12 months; that beats the revenue growth of 88.59% of US companies in our set.
- If you're looking for stocks that are quantitatively similar to SOFI TECHNOLOGIES INC, a group of peers worth examining would be OM, SMRT, LMND, STEM, and MXCT.
- SOFI's SEC filings can be seen here. And to visit SOFI TECHNOLOGIES INC's official web site, go to www.sofi.com.
SOFI Valuation Summary
- In comparison to the median Financial Services stock, SOFI's price/sales ratio is 104.35% higher, now standing at 4.7.
- Over the past 36 months, SOFI's EV/EBIT ratio has gone down 55.4.
Below are key valuation metrics over time for SOFI.
Stock | Date | P/S | P/B | P/E | EV/EBIT |
---|---|---|---|---|---|
SOFI | 2023-09-15 | 4.7 | 1.6 | -43.9 | -59.0 |
SOFI | 2023-09-14 | 4.6 | 1.6 | -43.8 | -58.9 |
SOFI | 2023-09-13 | 4.5 | 1.6 | -42.6 | -57.7 |
SOFI | 2023-09-12 | 4.6 | 1.6 | -43.6 | -58.7 |
SOFI | 2023-09-11 | 4.6 | 1.6 | -43.1 | -58.2 |
SOFI | 2023-09-08 | 4.4 | 1.5 | -41.4 | -56.5 |
SOFI's Quality Factors
The “Quality” component of the POWR Ratings focuses on 31 different factors of a companies fundamentals and operational strength. Here are some key insights as we drill into the specifics of these quality attributes.- SOFI has a Quality Grade of D, ranking ahead of 18.43% of graded US stocks.
- SOFI's asset turnover comes in at 0.244 -- ranking 30th of 428 Banking stocks.
- 500 - Internal server error
The table below shows SOFI's key quality metrics over time.
Period | Asset Turnover | Gross Margin | ROIC |
---|---|---|---|
2021-06-30 | 0.244 | 0.701 | -0.145 |
SOFI Price Target
For more insight on analysts targets of SOFI, see our SOFI price target page. And for a list of of all stocks sorted by upside potential based on analyst target price, see our Top Price Target page.
Average Price Target | $24.38 | Average Broker Recommendation | 1.4 (Strong Buy) |
SoFi Technologies Inc. (SOFI) Company Bio
SoFi Technologies, Inc., a finance company, operates an online platform that provides financial services. It offers student loan refinancing, private student loans, personal loans, auto loan refinance, home loans, mortgage loans, and investments, as well as insurance products for renters, homeowners, automobiles, and others. The company was incorporated in 2011 and is based in San Francisco, California.
Latest SOFI News From Around the Web
Below are the latest news stories about SOFI TECHNOLOGIES INC that investors may wish to consider to help them evaluate SOFI as an investment opportunity.
Most Active Equity Options For Midday - Monday, Sept. 25Here are the most active equity options for midday. |
Why Did SoFi Stock Drop 20% Last Week?In this video, I will talk about SoFi Technologies (NASDAQ: SOFI), why the stock crashed 20% last week, the possible impact of underwriting the Instacart IPO, and why I believe this company will reward long-term investors. |
Better Buy: SoFi Stock or Nu Stock?Fintech continues to become a way of life for many people around the world who rely on smartphones and digital technology to run their finances and make purchases. But it's also a good example of thinking long term if you understand how a company works and why it deserves confidence. |
Most Active Equity Options For Midday - Friday, Sep. 22Here are the most active equity options for midday. |
7 Early-Stage Stocks With Enormous Wealth-Making PotentialEarly-stage stock investing is tricky, but these seven companies present compelling upside potential alongside viable fundamentals |
SOFI Price Returns
1-mo | -10.74% |
3-mo | -16.57% |
6-mo | 29.37% |
1-year | 45.67% |
3-year | N/A |
5-year | N/A |
YTD | 60.52% |
2022 | -70.84% |
2021 | 27.09% |
2020 | N/A |
2019 | N/A |
2018 | N/A |
Loading social stream, please wait...